Don't Panic When Services Slow Down Find Root Cause in Minutes with Syncause
UCIndex: UC01
Challenge: Difficult to Quickly Identify Root Cause
In complex distributed systems, "service response slowdown" is one of the most common and troublesome issues. Traditional troubleshooting approaches have two major pain points:
- Cumbersome process, low efficiency Engineers need to repeatedly switch between monitoring dashboards, logs, and call traces to investigate the root cause layer by layer, often taking tens of minutes or even hours.
- Limited positioning granularity Logs and call traces can usually only tell you "which service is slow," but cannot deeply answer whether it's a CPU bottleneck, disk I/O issue, or network performance degradation.
Solution: Intelligent Integration and Analysis Based on eBPF Technology
Syncause is based on eBPF technology, which can directly collect resource usage during program execution from the kernel, including:
- CPU usage and scheduling wait time
- File/disk read/write time
- Network and downstream dependency call time
- Lock wait time
Therefore, when you discover a service is slowing down, you no longer need to manually switch panels and investigate logs one by one. Just ask one question:
Why is the
xxxservice response slowing down?
Syncause will automatically combine kernel-level data with existing monitoring and logs to provide clear root cause analysis in minutes:
- Insufficient CPU resources → causing request backlog
- Excessive disk read/write time → significantly increased response latency
- Increased downstream dependency latency → overall service blockage
Effects and Value
- Minute-level root cause identification — replacing manual investigation that originally took hours
- Breaking through traditional APM limitations — evolving from "knowing which service is slow" to "knowing why the service is slow"
- Natural language interaction — simplifying complex performance diagnosis problems into a single question
- Kernel-level visibility — providing performance insights that traditional monitoring and call traces cannot reach
Usage Steps
- Open Syncause and start communicating with the SRE Agent
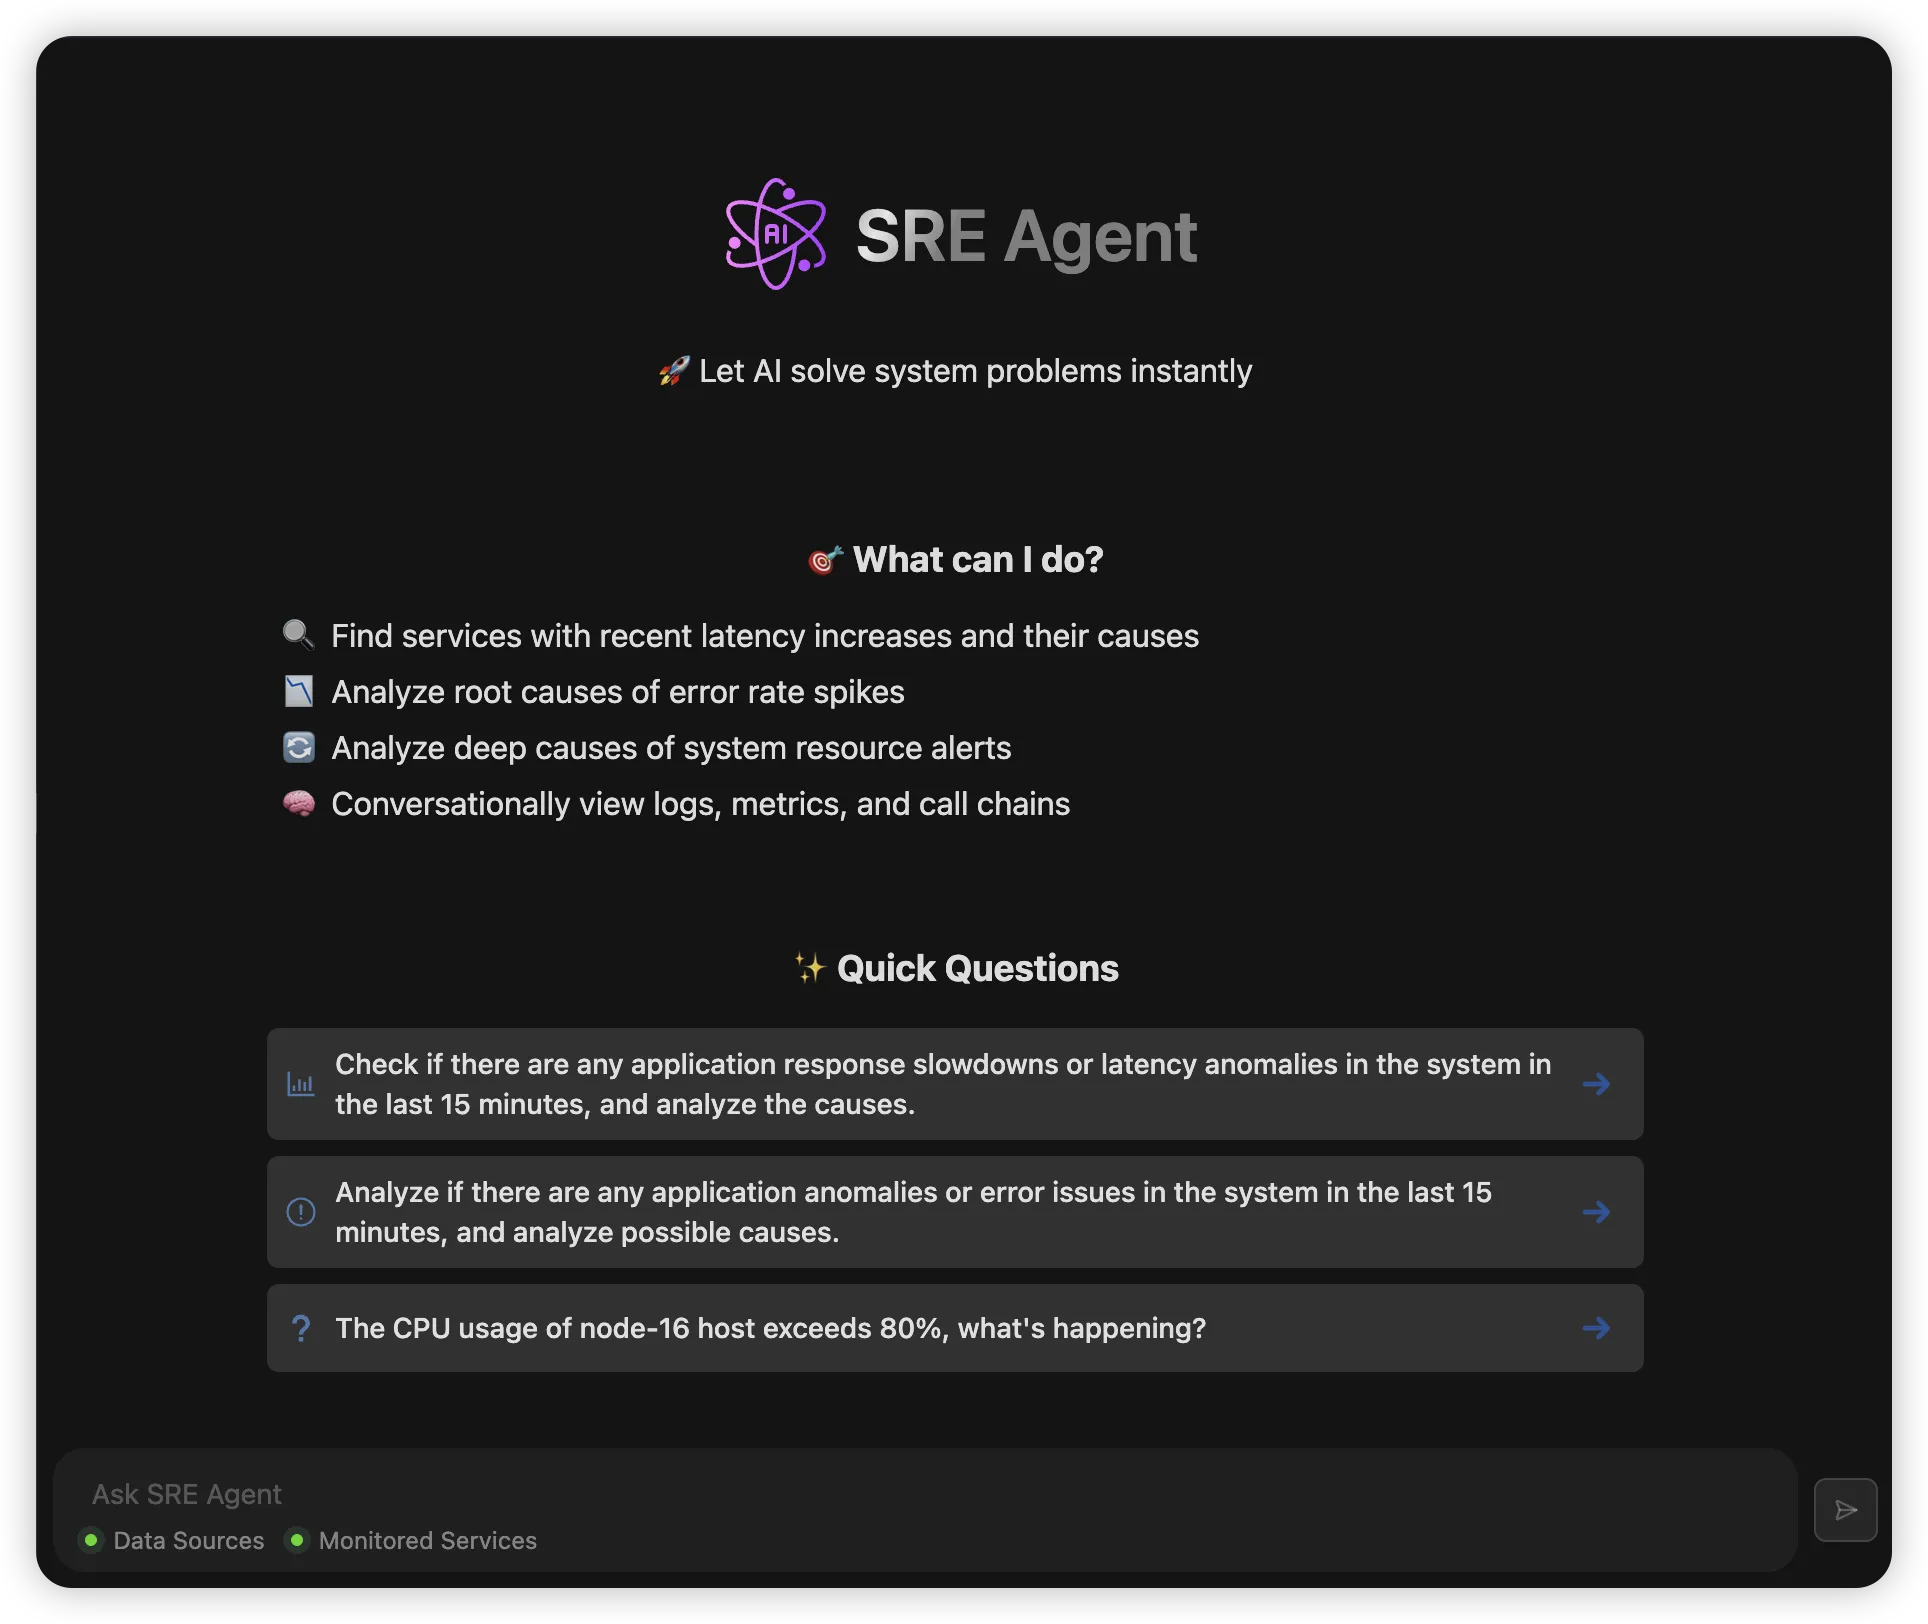
- Ask directly in natural language: "Why is the order service response time slowing down?":

- Syncause automatically queries and analyzes related metrics, logs, call traces, and eBPF kernel data. Each step is explanatory.
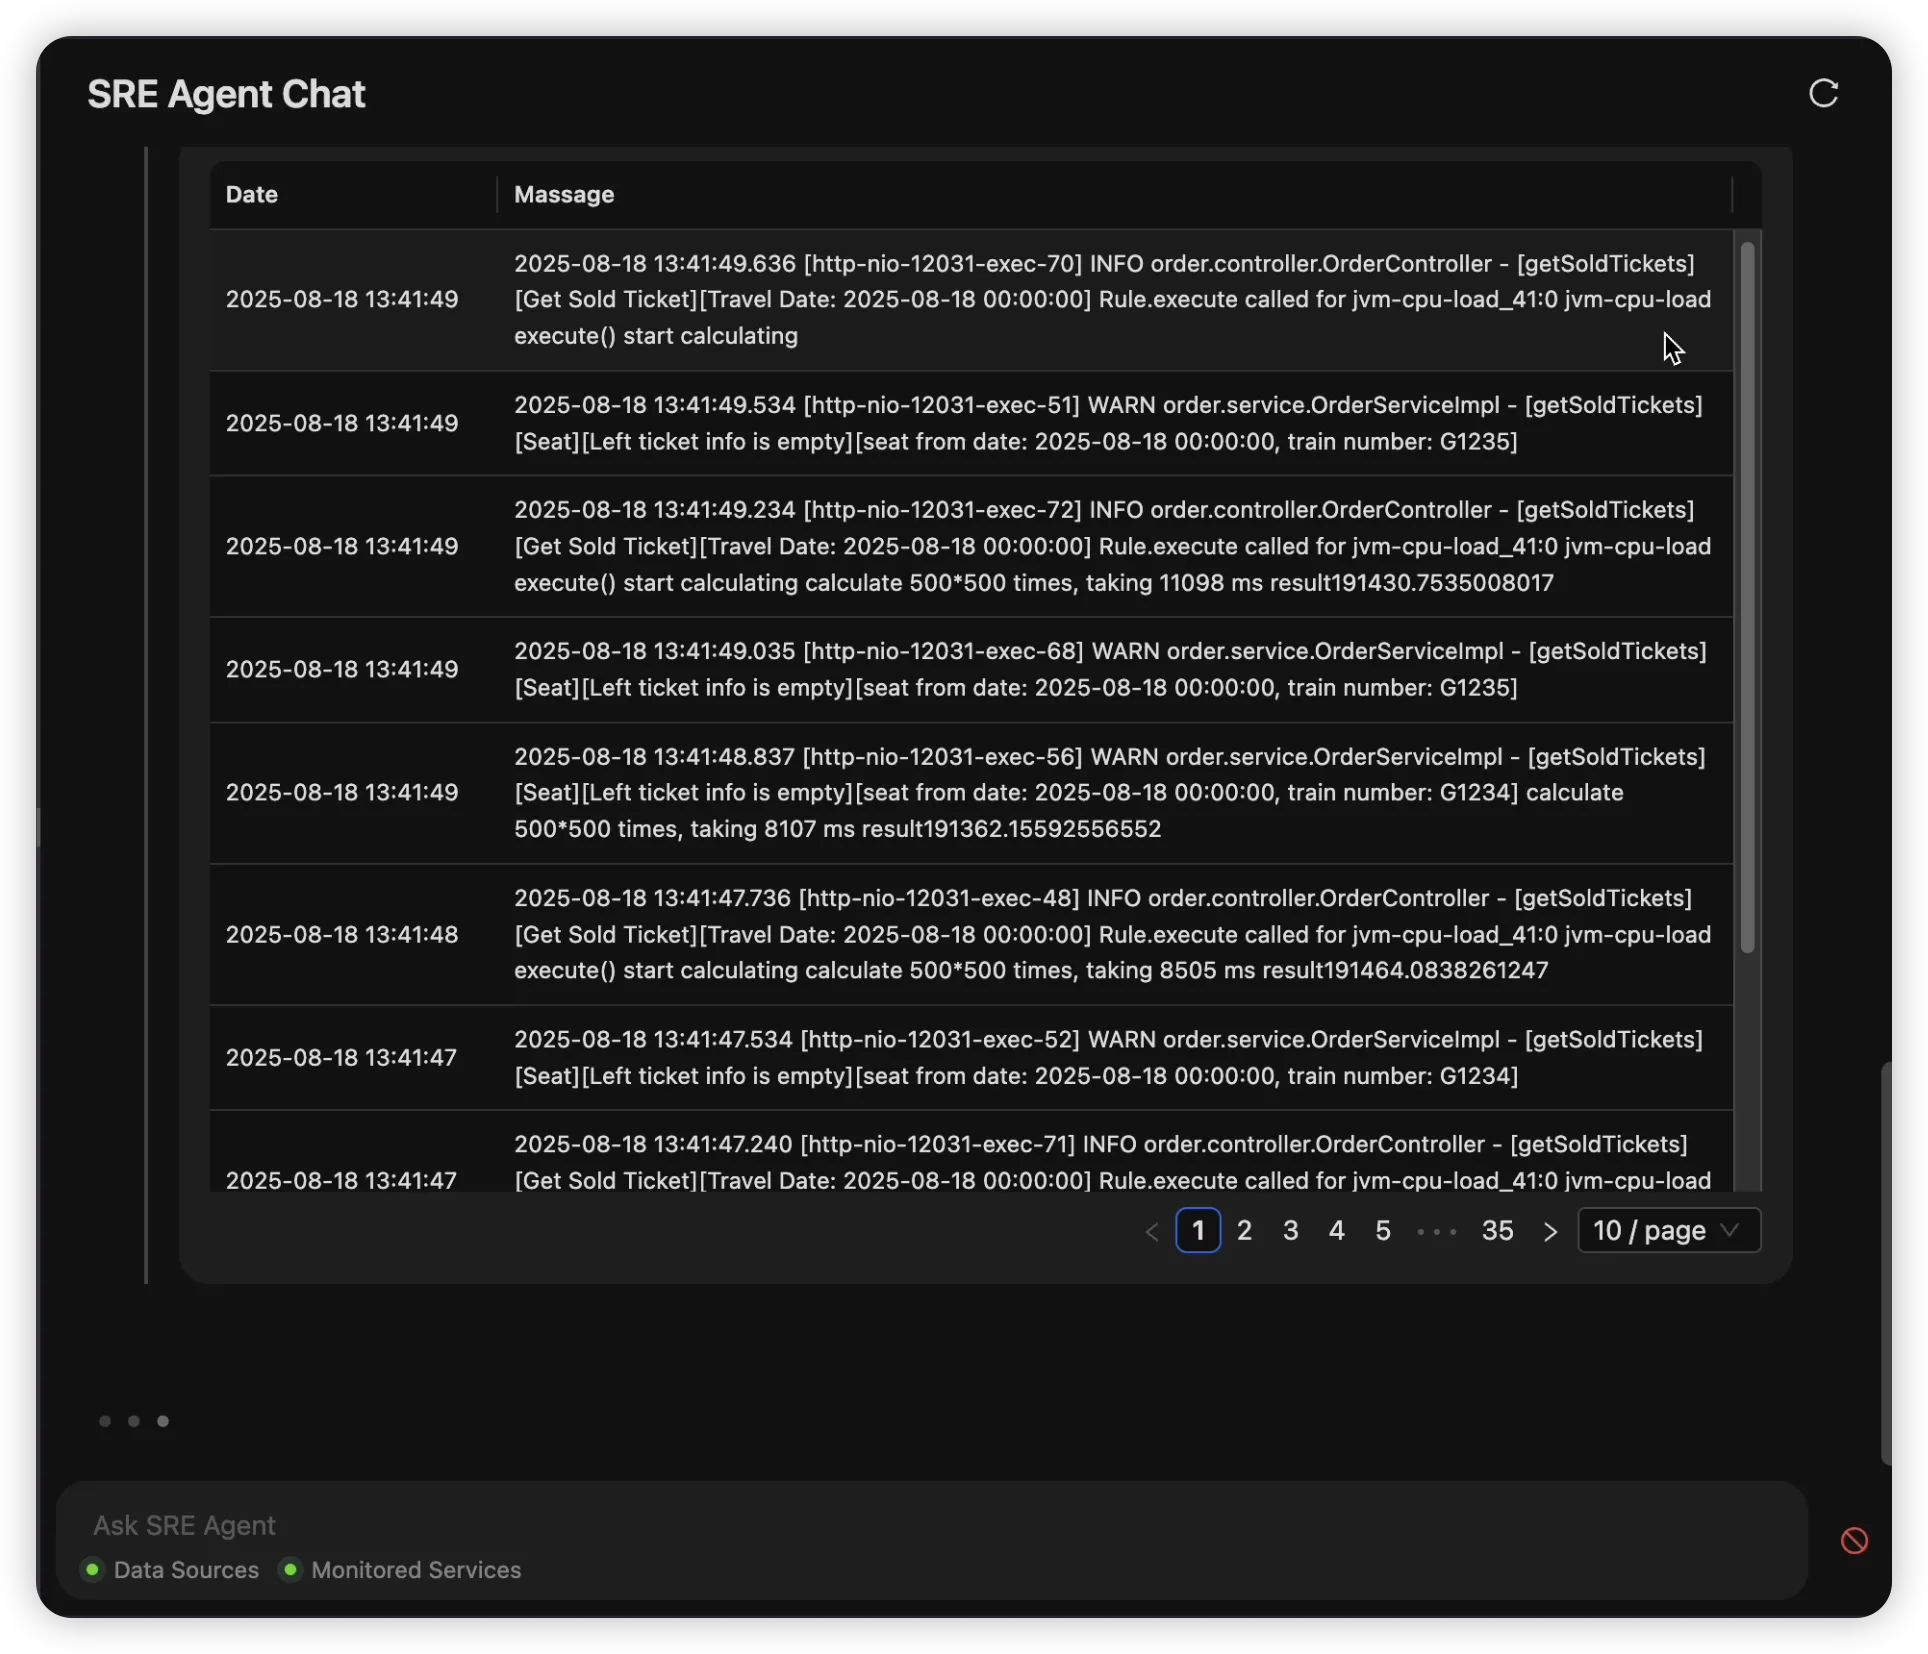
(Querying related logs)
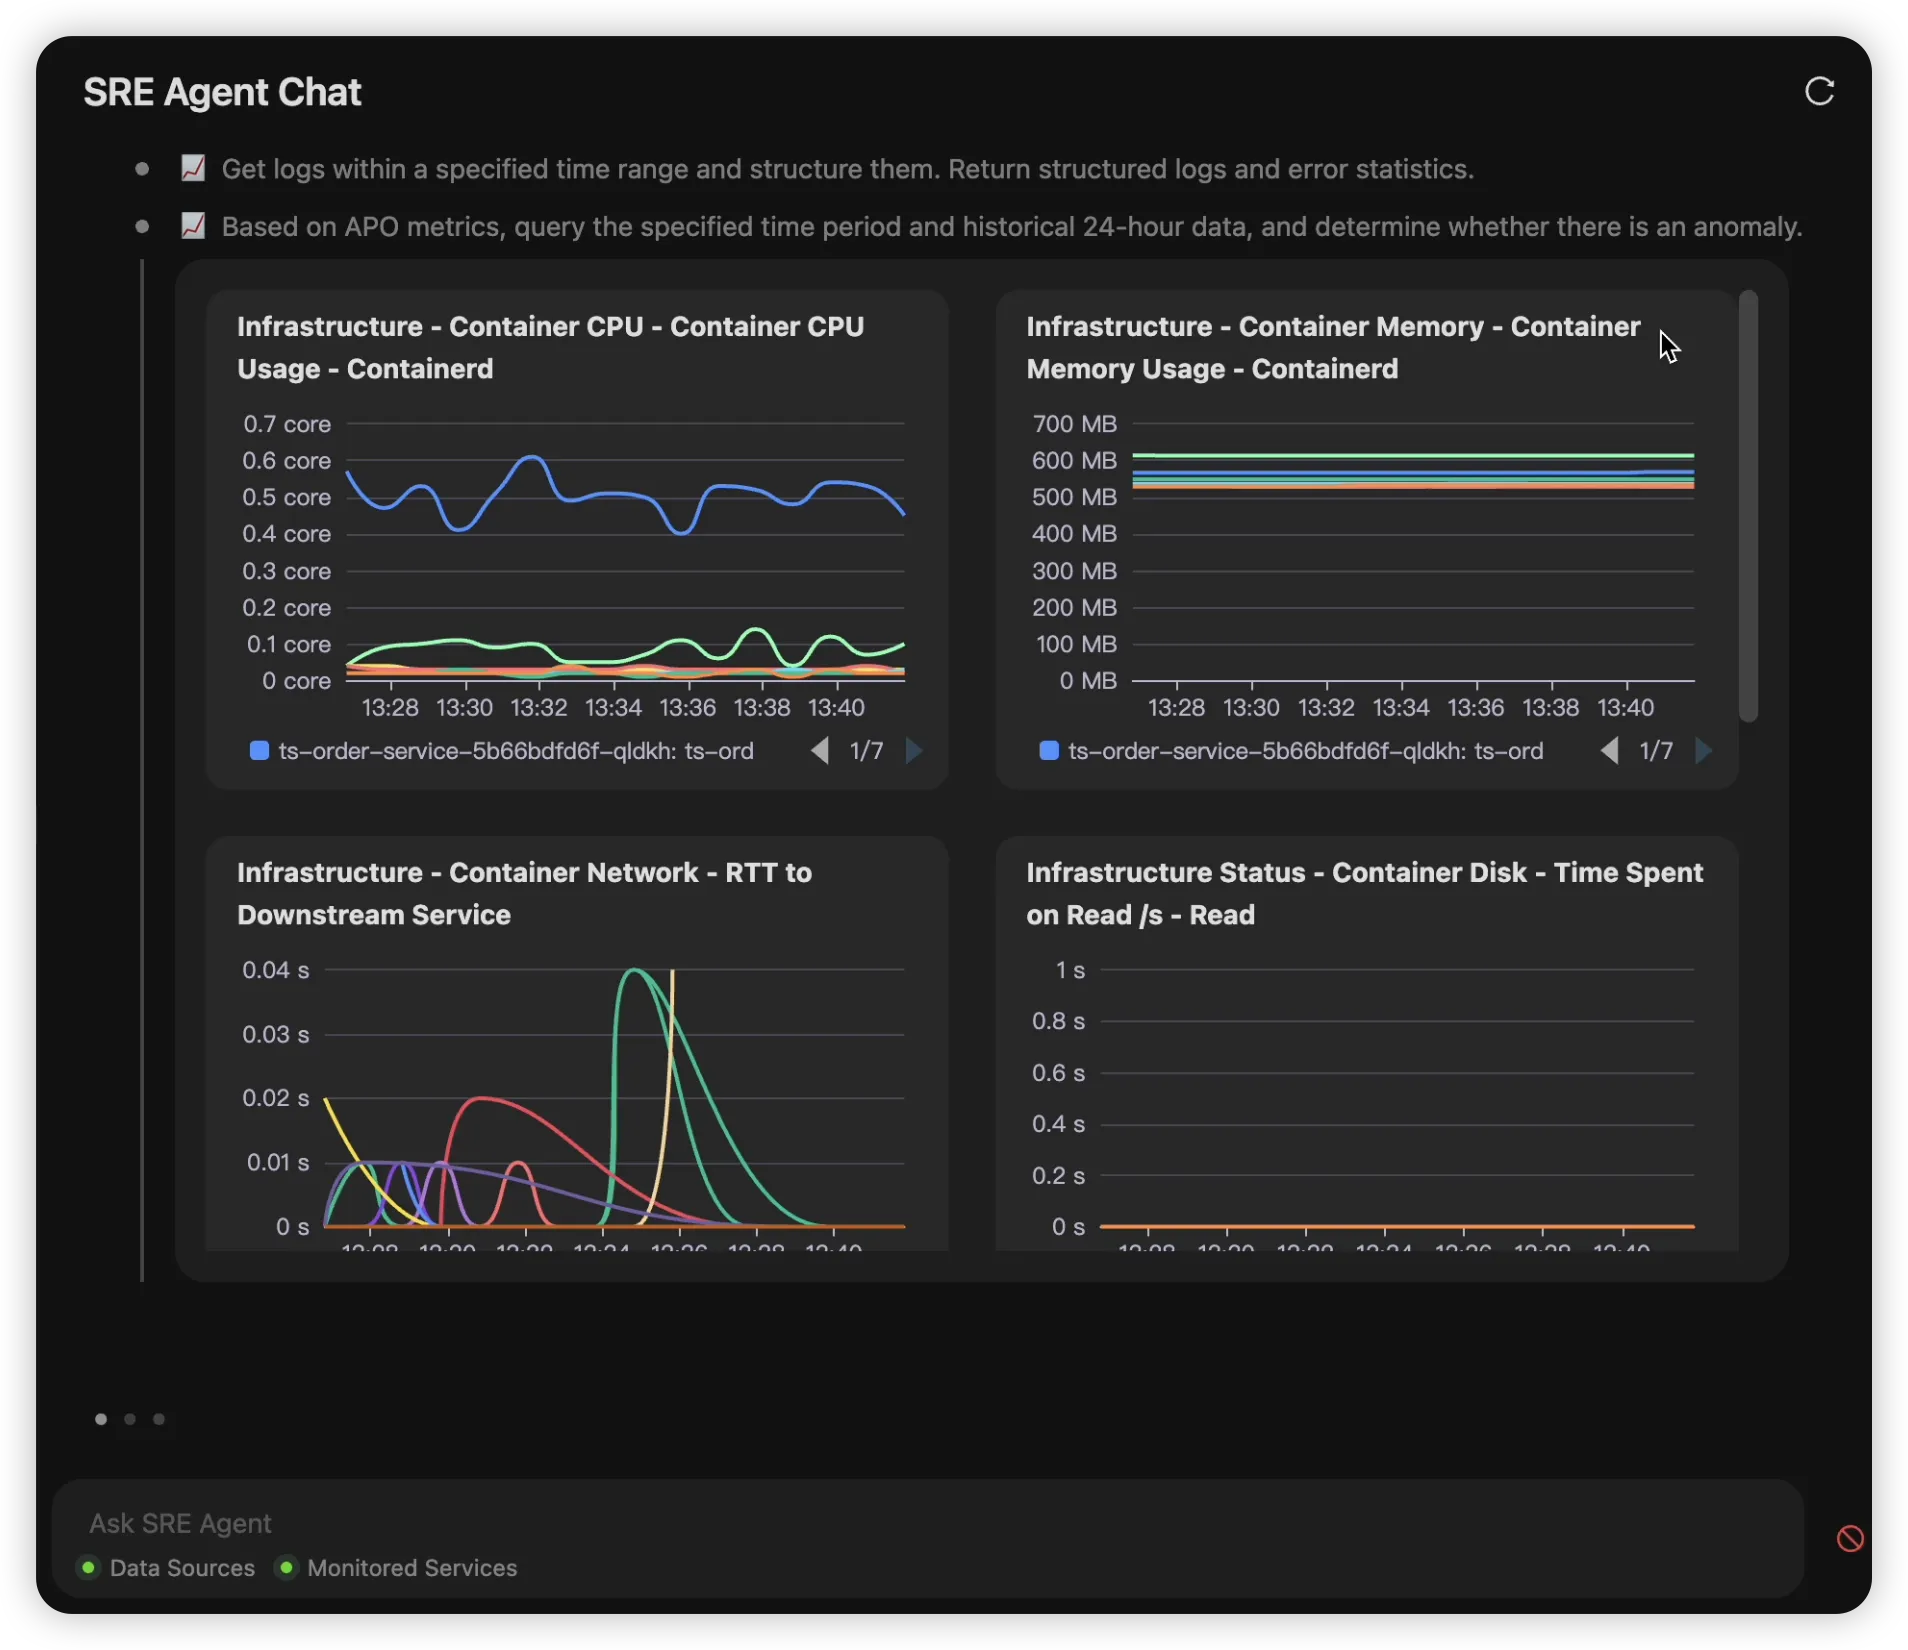
(Querying related metrics)
- Get root cause conclusions, with detailed evidence supporting each conclusion.
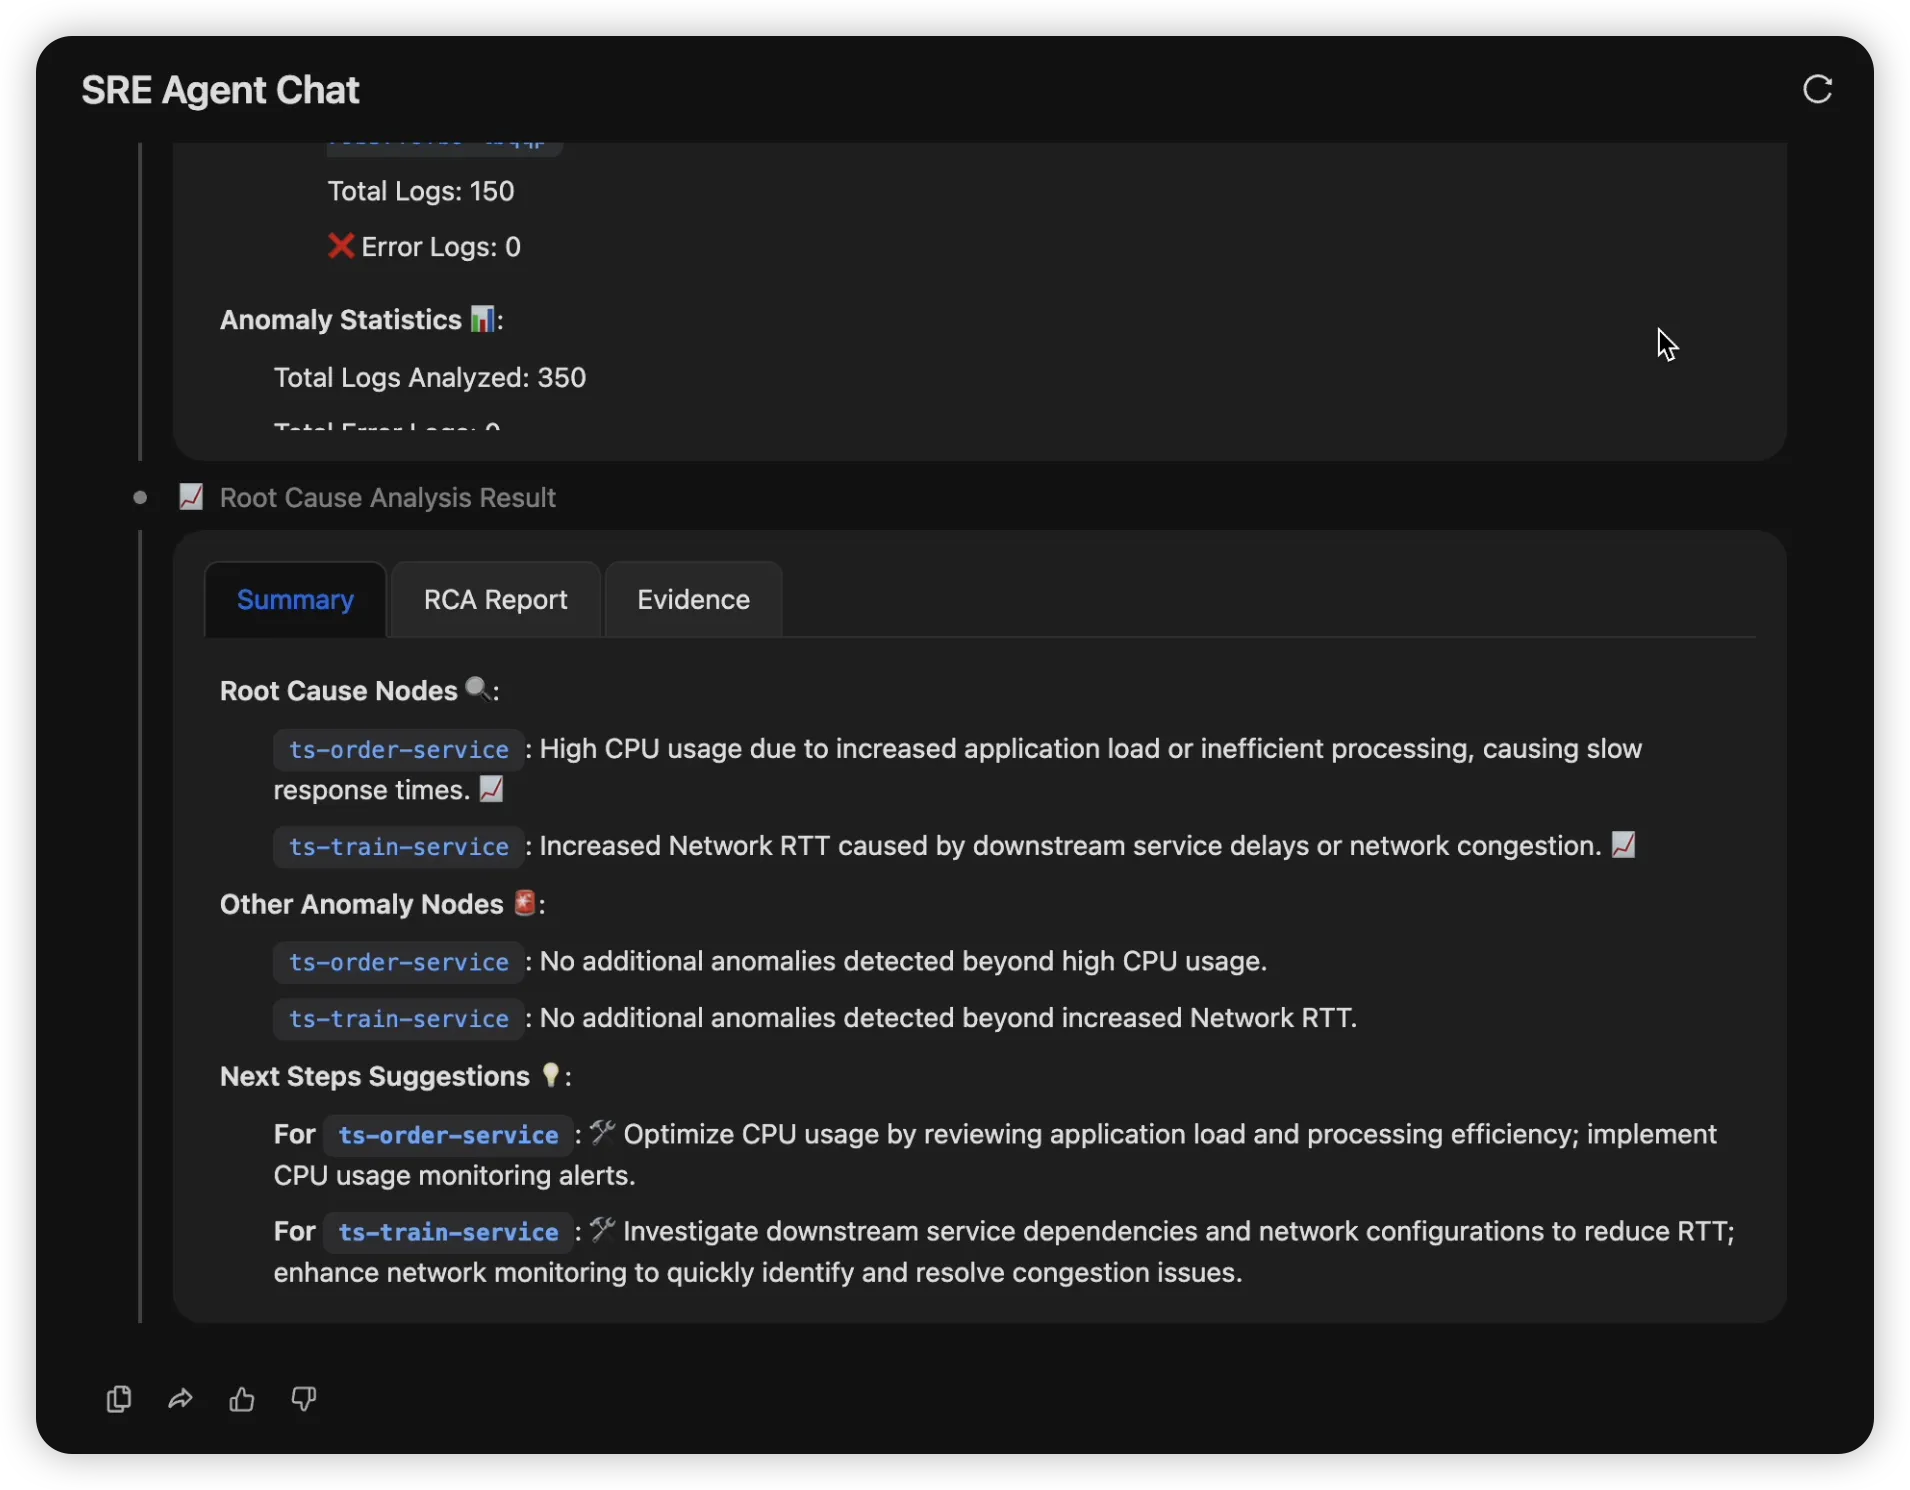
(Summary of problem conclusions)
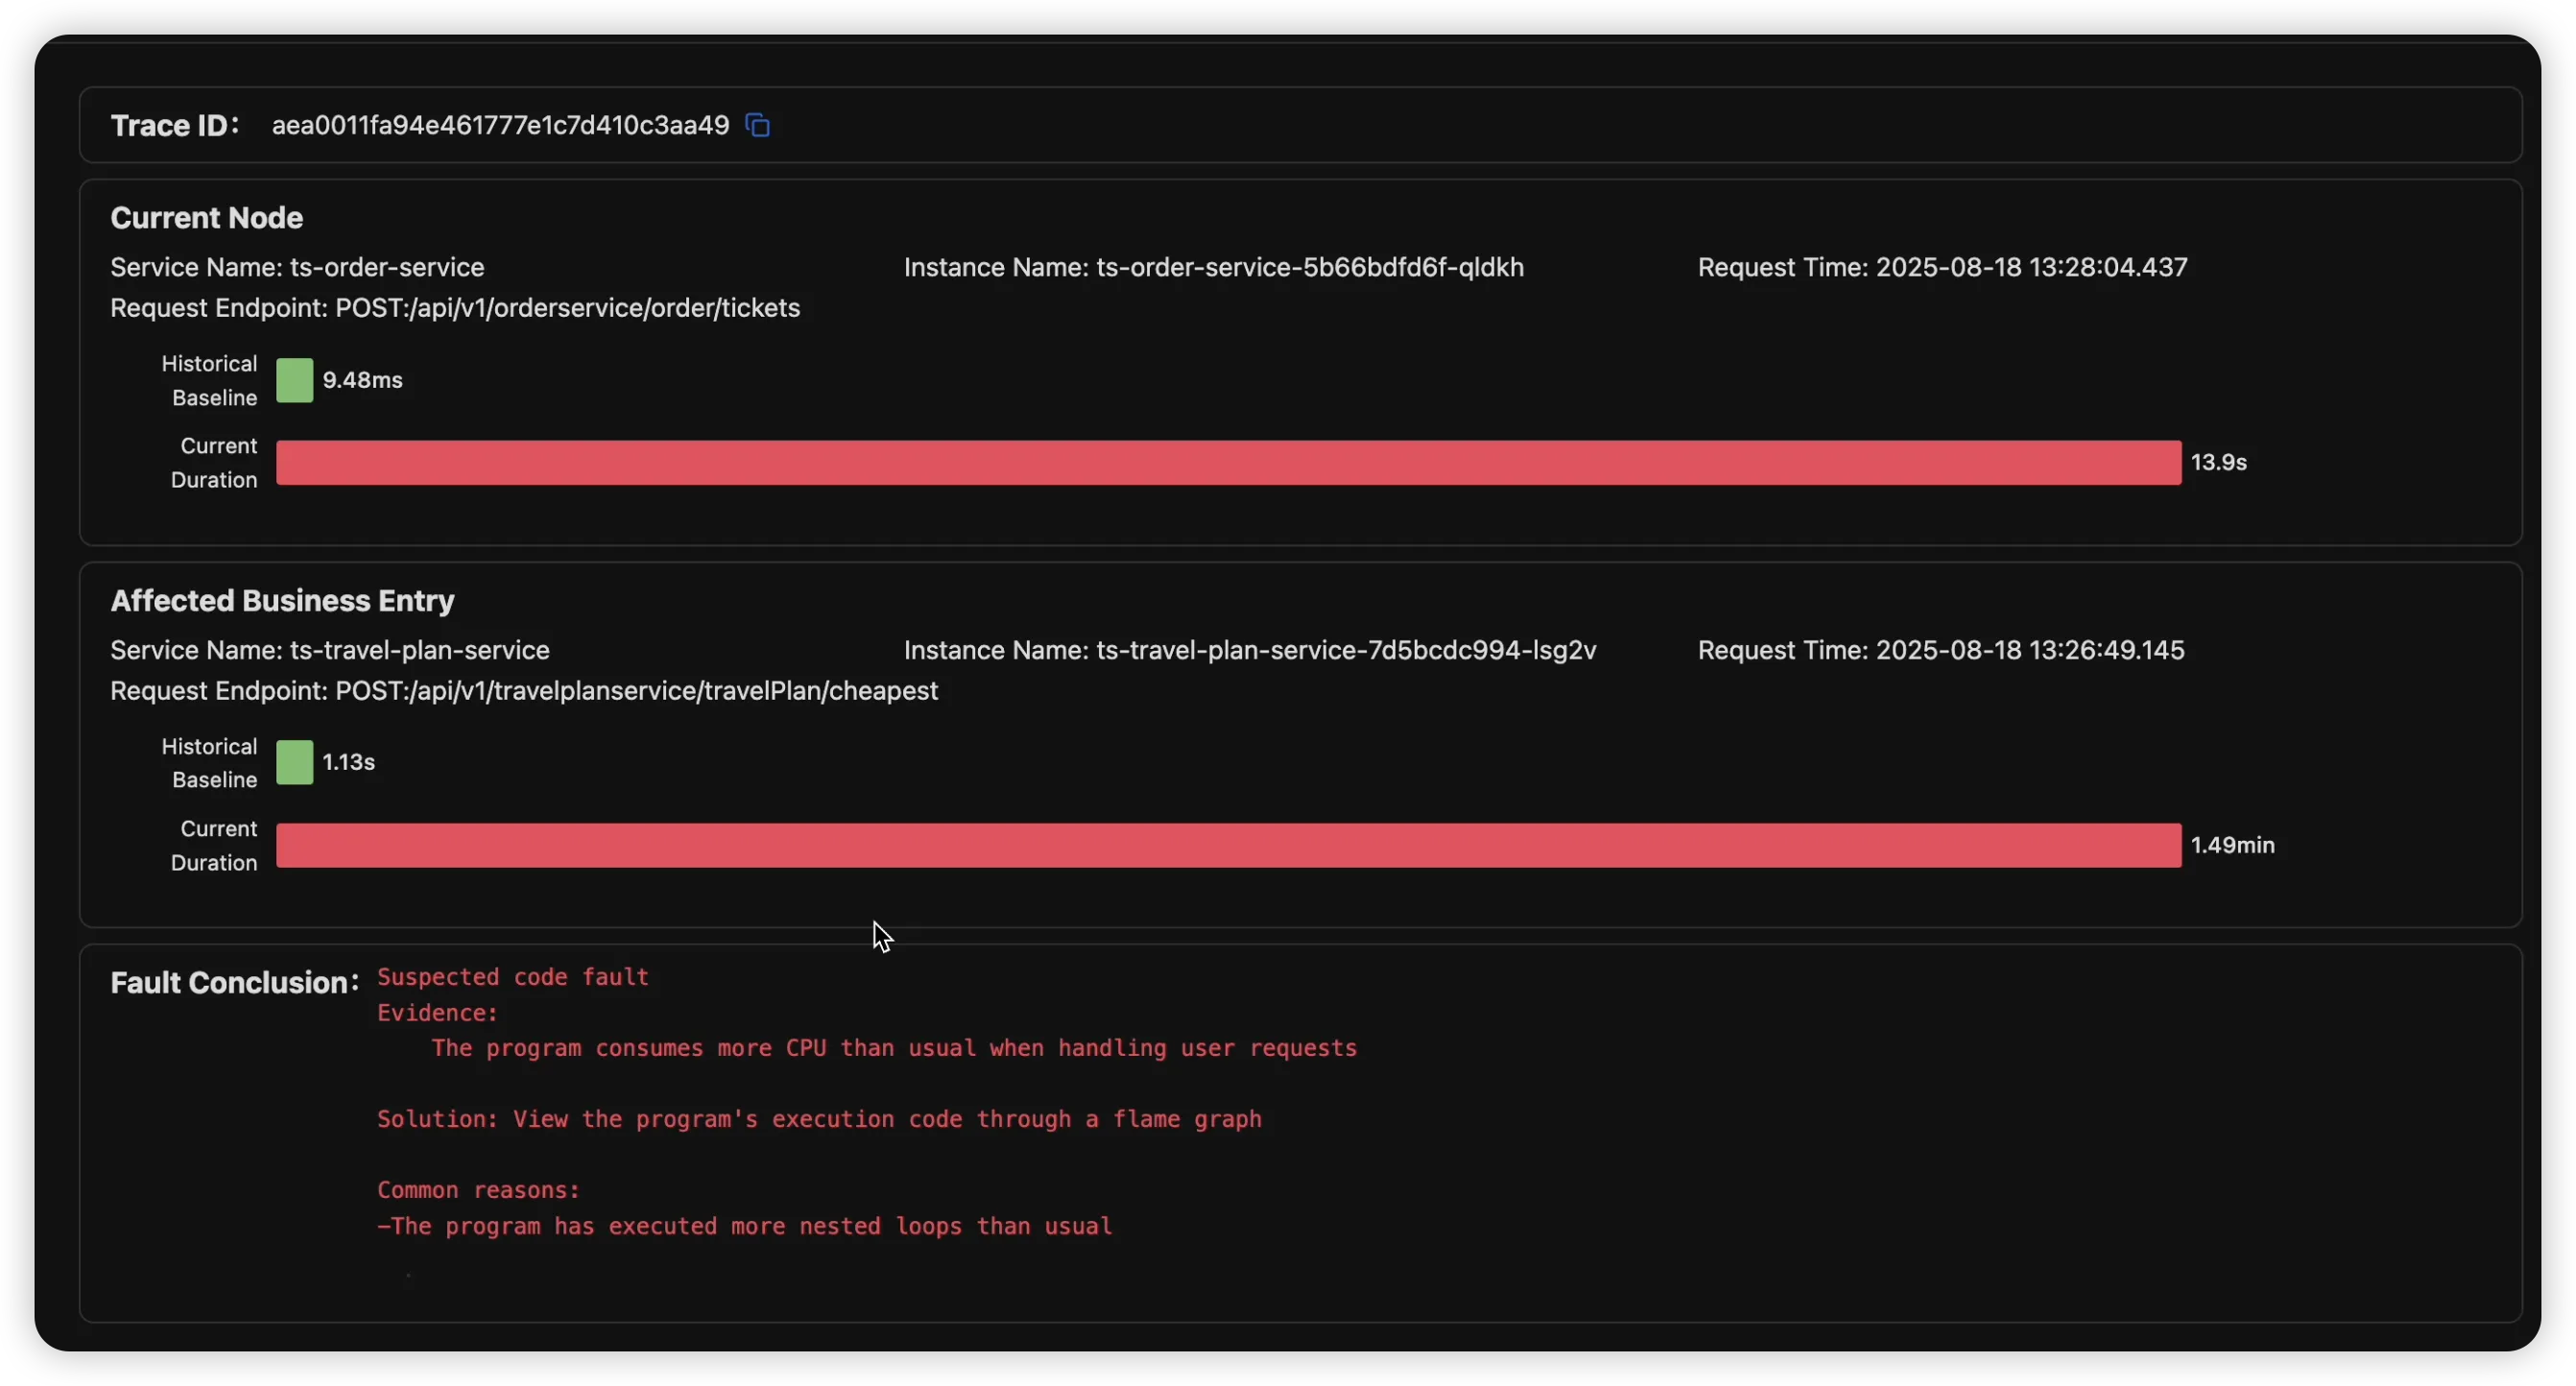
(Detailed data evidence)
Want to try it right away? No registration or installation required, try our online sandbox and experience the next generation of intelligence immediately!
