Grafana Tempo Cloud
Supported Data Types:
TraceRedMetricServiceInstanceTopology
This document describes how to integrate Trace, RedMetric, ServiceInstance, Topology data from Grafana Tempo Cloud into Syncause.
- You need access to a running Syncause service to complete this tutorial. For instructions, please refer to the "Setup" section.
- You need a Grafana Cloud account with Tempo features enabled. For Grafana Tempo Community Edition, please refer to the document Grafana Tempo CE.
- Access Syncause's
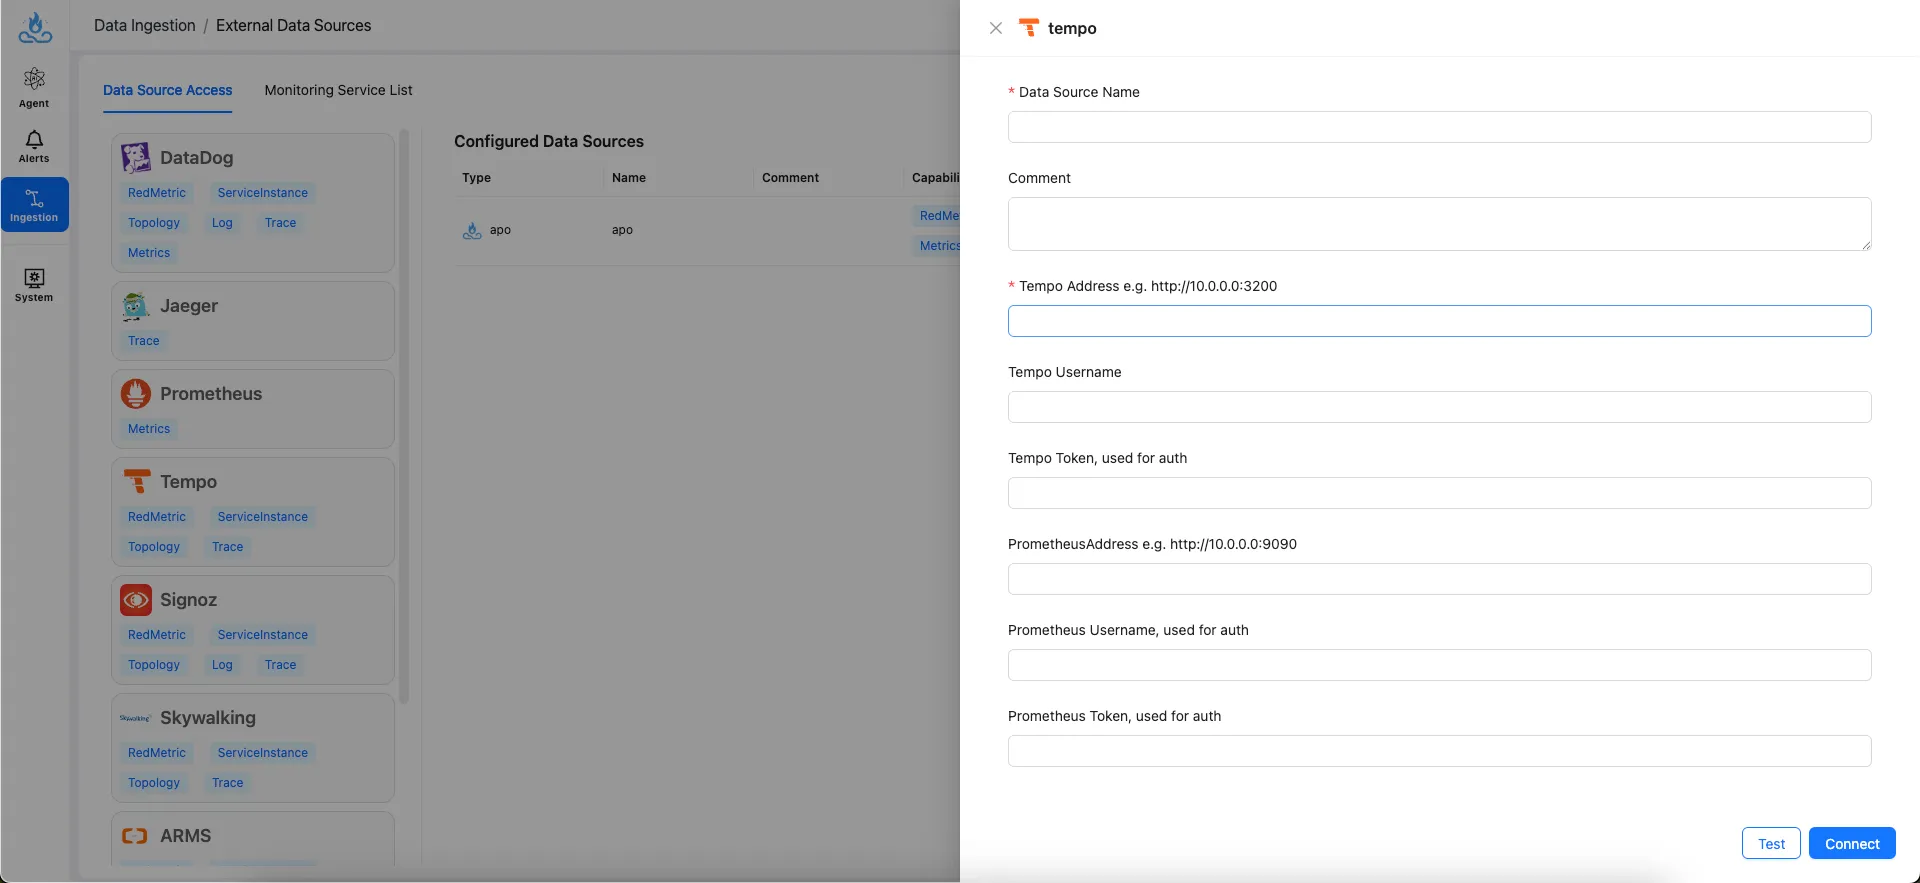
Ingestion>External Data Sources> clickTempoto create a new Grafana Tempo data type.
Grafana Tempo Cloud's Service Graph (Topology) is not automatically generated. If it's missing, you need to enable Observability -> Application to generate this data, which may incur charges. Topology-related metrics can be integrated via Prometheus.
Parameter Description
| Parameter | Description | Example |
|---|---|---|
| Data Source name | Data Source Name | my-datadog |
| Comment | Data Source Comment | |
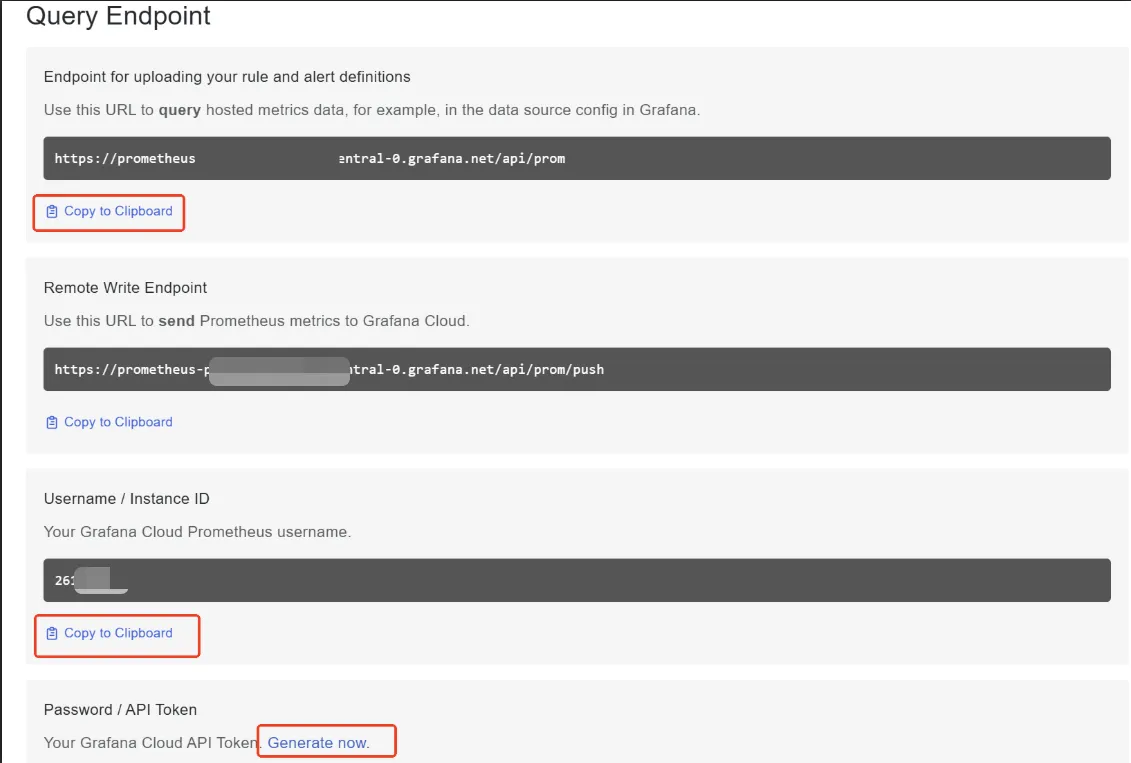
| Tempo Address | Grafana Tempo server address | http://tempo-xxxxxx-xxxx.grafana.net/tempo |
| Tempo Username | Tempo Username | 1234567 |
| Tempo Token | Tempo Access Token | |
| PrometheusAddress | (Optional) Prometheus address for querying topology | http://prometheus-xxxxxx-xxxx.grafana.net/api/prom/push |
| Prometheus Username | (Optional) Prometheus Username for querying topology | 1234567 |
| Prometheus Token | (Optional) Prometheus Access Token for querying topology |
Detailed Instructions
Retrieve Tempo Address & Username & Token
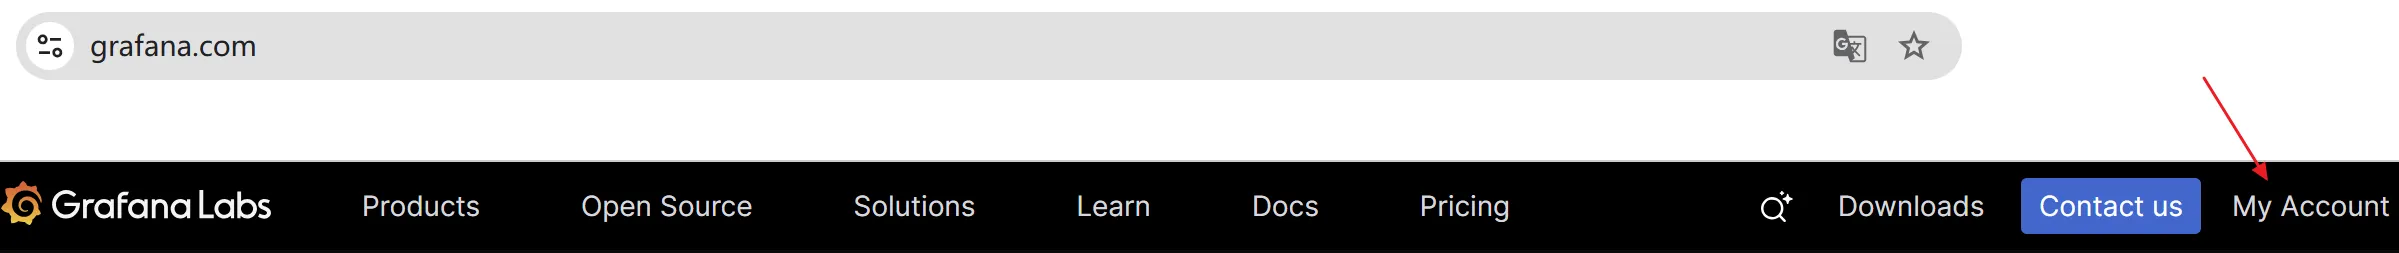
Homepage -> Click My Account.
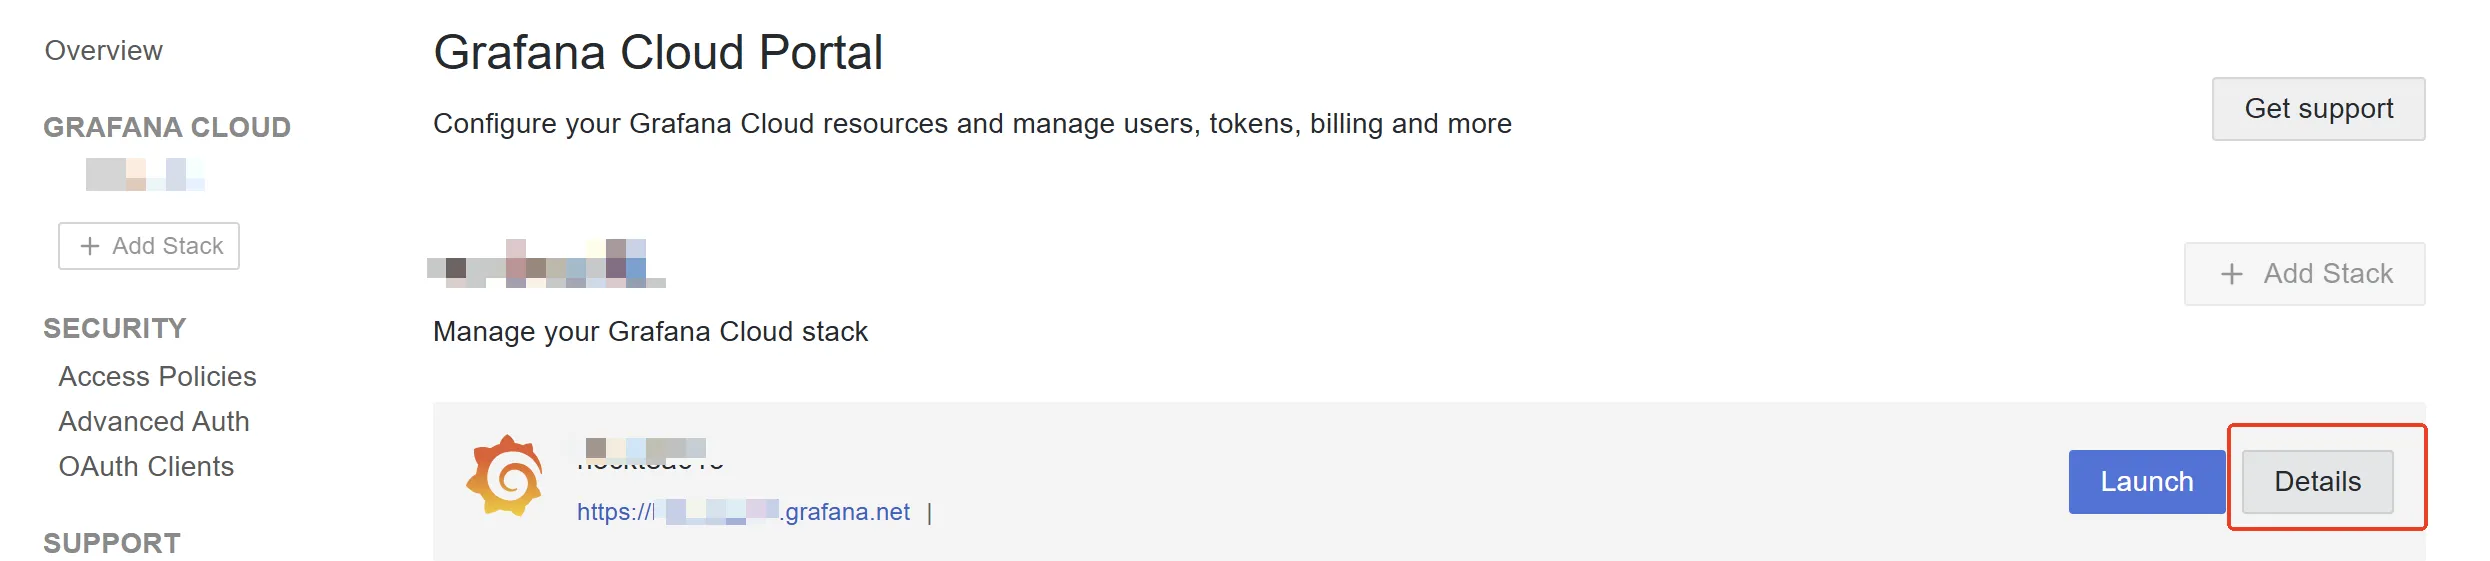
Select Detail of Grafana Cloud Stack.
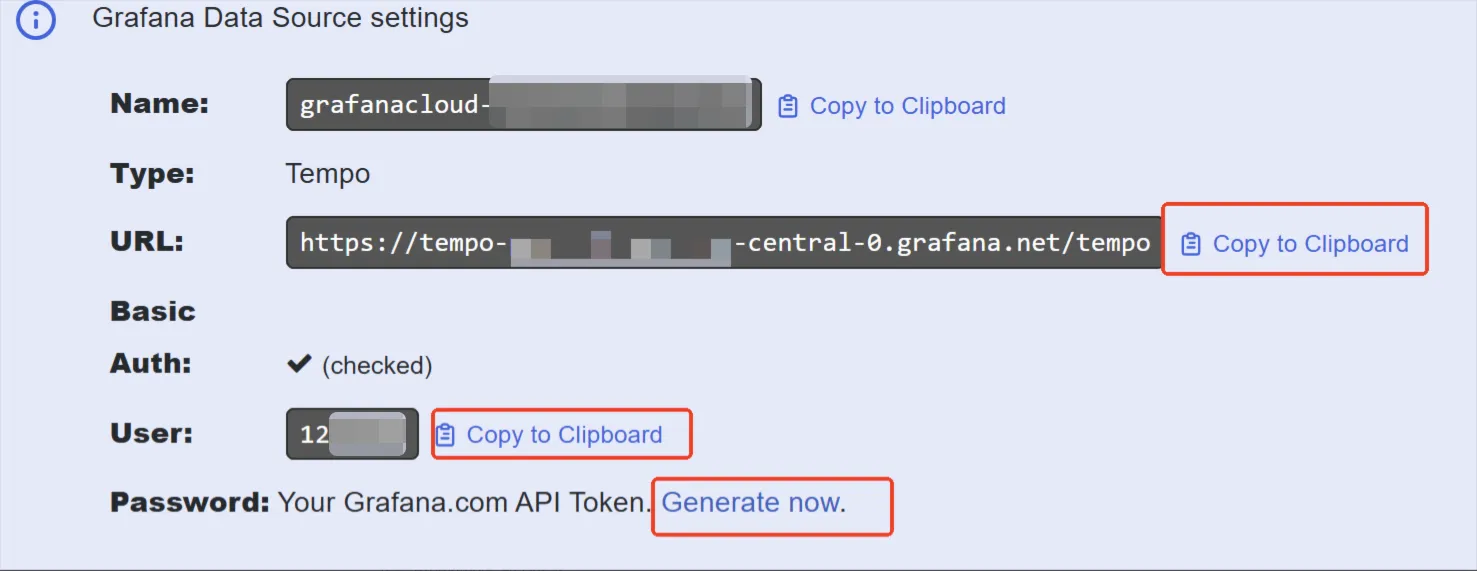
View Tempo Details.

Fill the URL value into Tempo Address parameter; User value into Tempo Username parameter; Password value into Tempo Token parameter.
Retrieve PrometheusAddress & Username & Token
Select Prometheus Detail.
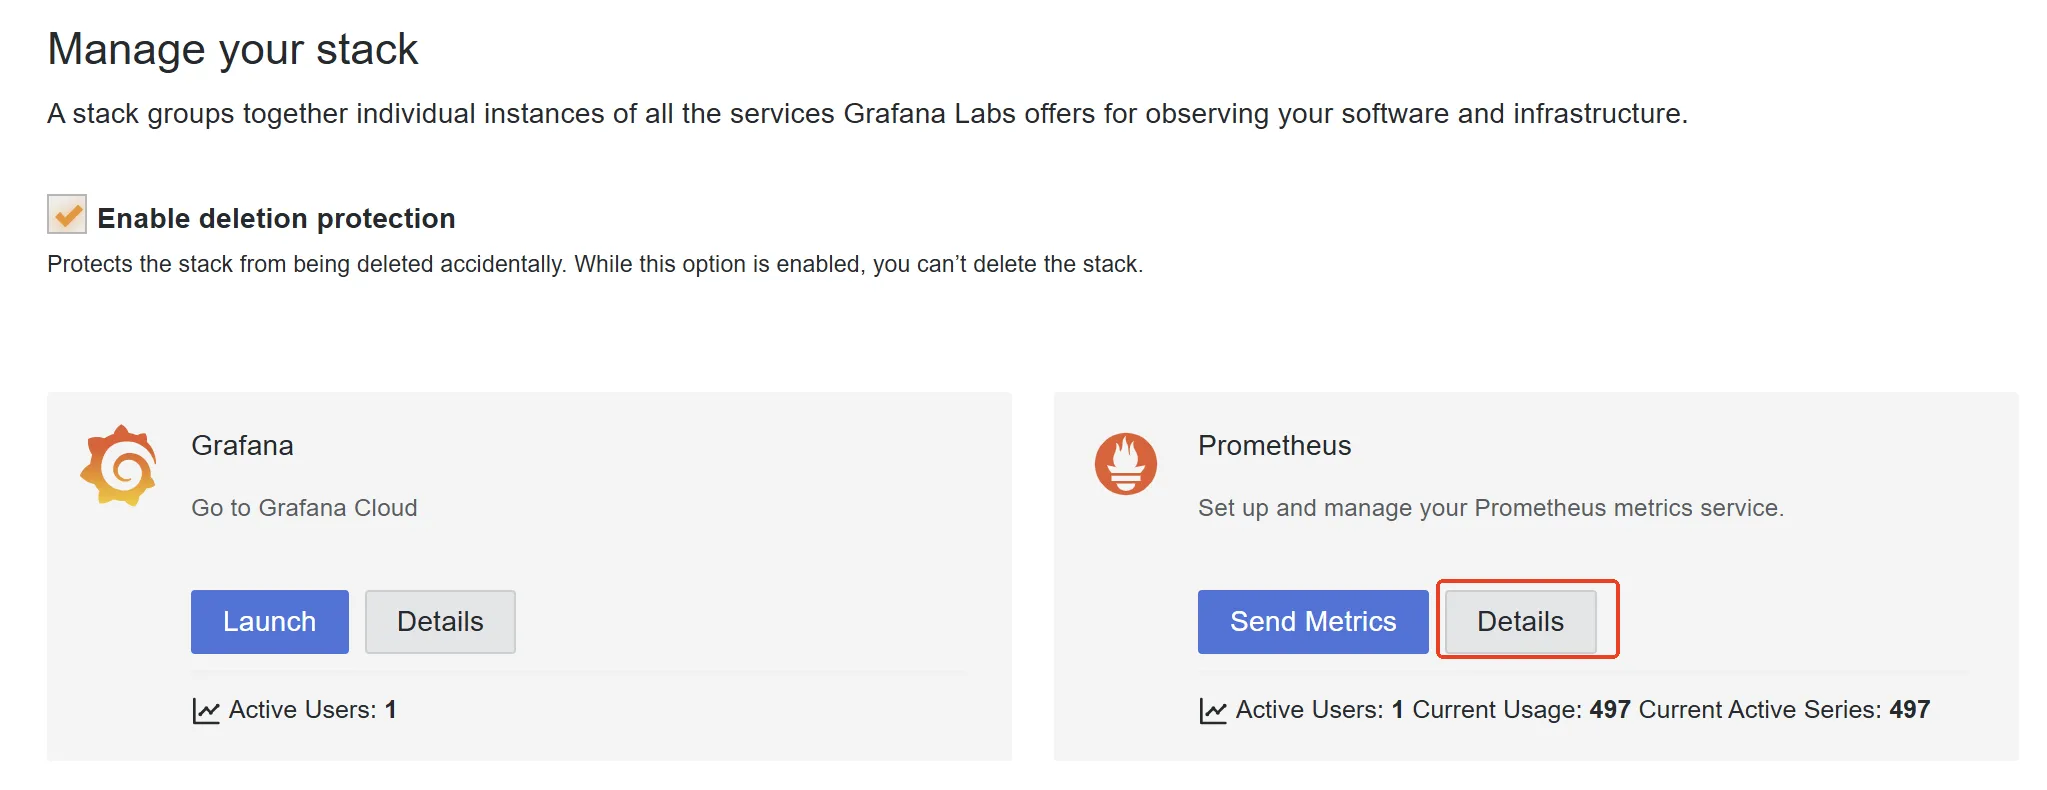
Fill the URL value into PrometheusAddress parameter; User value into Prometheus Username parameter; Password value into Prometheus Token parameter.