Debug without reproducing: Repurpose OpenTelemetry for coding agents

We have repurposed OpenTelemetry (OTel) from a production observability tool into a local, zero-config debugging context specifically for AI coding agents like Cursor and Copilot. This allows agents to automatically capture bug context and fix issues rapidly.
We’ve noticed a recurring friction point when using AI for coding: Debugging. AI agents are great at generating code, but they are terrible at fixing bugs without context. To make matters worse, some bugs are notoriously difficult to reproduce.
Currently, the debugging workflow for human programmers and Coding Agents usually looks like this:
- Agent writes code -> Bug appears.
- Agent guesses the cause.
- Agent asks to add console.log or print statements.
- User restarts the app (losing state).
- User tries to reproduce the bug exactly.
This cycle is already painful for humans, but for a Coding Agent, it is devastating. The agent gets trapped in a "Guess -> Log -> Restart" loop. This not only burns through tokens and wastes time but often fails completely on hard-to-reproduce issues.
We realized that observability data is the natural context for coding agents. It contains exactly what the AI needs: metrics, logs, method calls, and traces. If we can lower the barrier to enabling observability—no code changes, no configuration, no data egress, and no need to understand complex dashboards—even independent developers can use it immediately. This makes solving bugs effortless for coding agents.
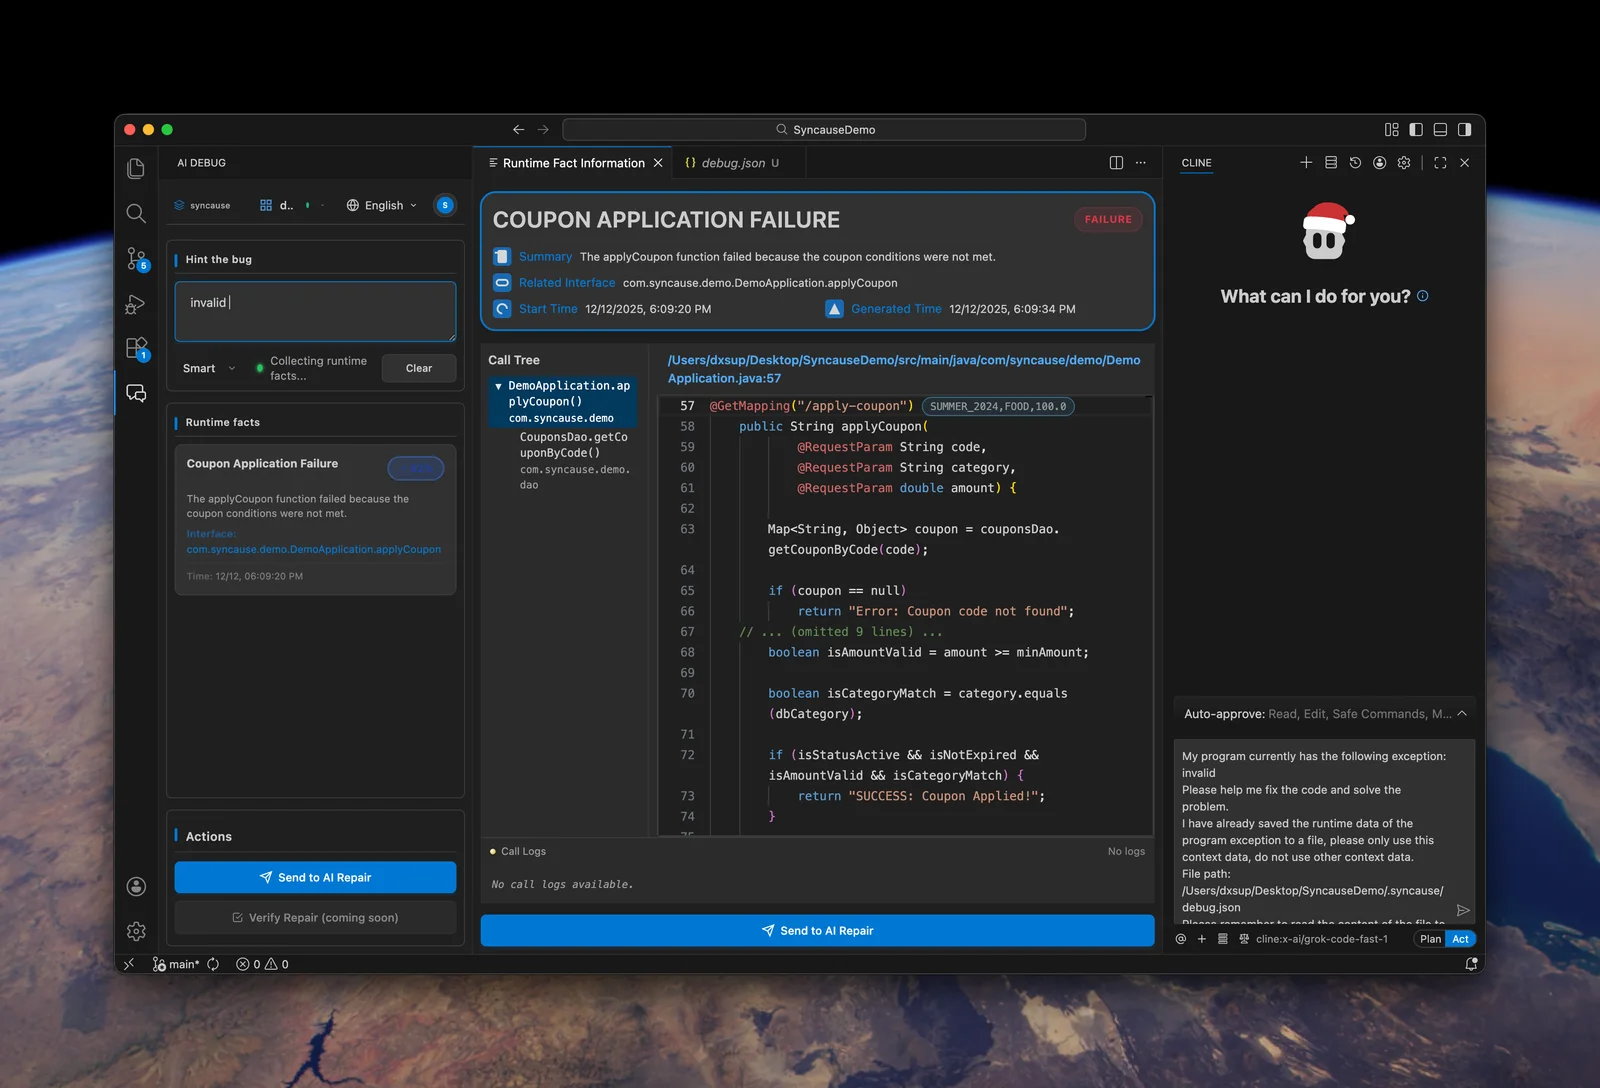
So, we built Syncause to provide the AI with sufficient runtime context during the debugging process, effectively skipping the "reproduction" step entirely via time-travel debugging. In this article, we explain how Syncause applies observability concepts to the debugging scenario.
High-Level Architecture
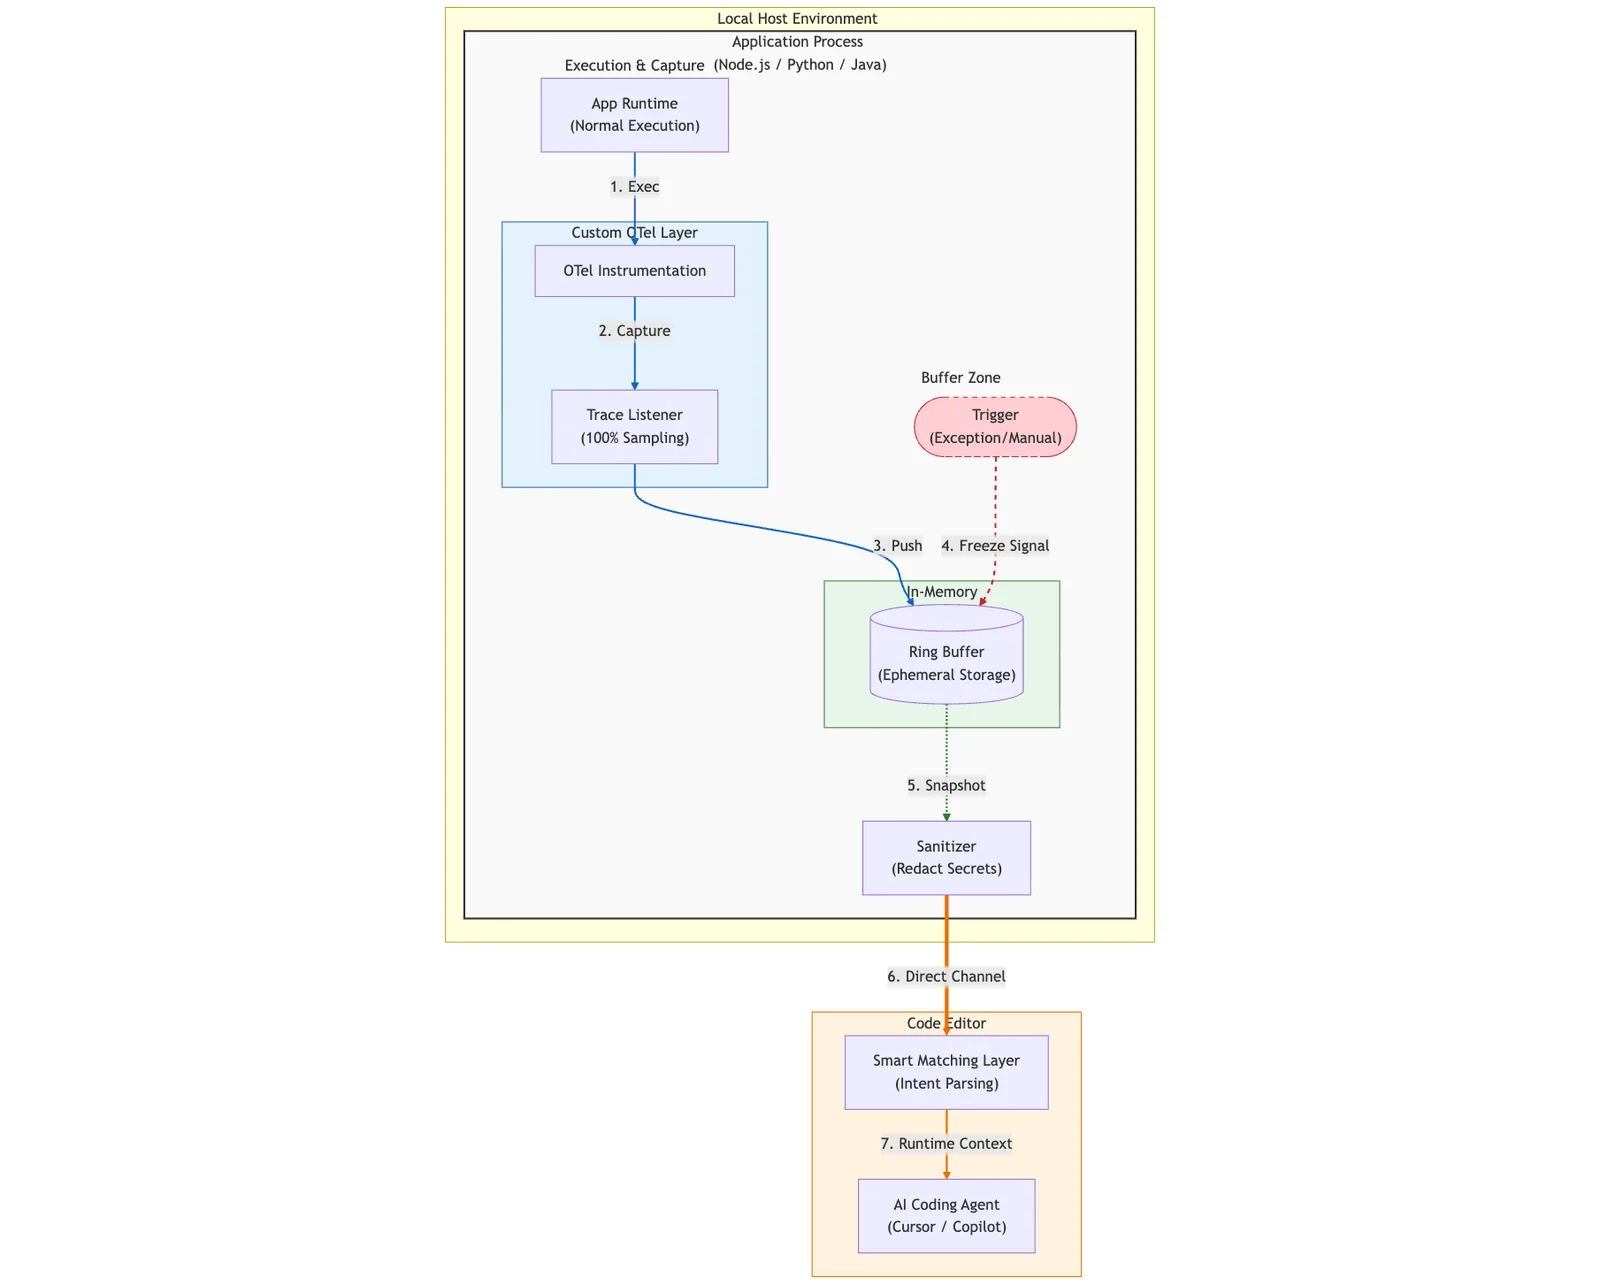
Observability shouldn't just be for SREs; it could be for coding agents. Syncause functions as a local flight recorder that lives entirely within your development environment.
We realized that distributed tracing via OpenTelemetry (OTel) already captures the exact data we need. However, we had to re-architect it for a "Local-First" debugging scenario rather than a "Remote-Ops" monitoring scenario.
The architecture consists of three main stages:
- In-Process Capture: A custom OTel exporter captures 100% of runtime data into a circular memory buffer.
- Freeze & Snapshot: When a bug occurs (exception or manual trigger), the buffer freezes to capture the history.
- Local Delivery: Data is sanitized and passed directly to the AI Agent in your IDE to perform the fix.
Below, we detail the three technical pillars that make this architecture work.

1. The Core Mechanism: OTel + Ring Buffers
Standard OTel is typically designed for Ops, not Devs. Typically, it samples only 1% of traces, strips detailed variables to save bandwidth, and sends data to a remote backend (like Datadog or Jaeger) with seconds of latency.
For debugging, we need 100% of traces, full variable fidelity, and 0ms latency. To achieve this, we built a custom OTel Exporter based on an In-Memory Ring Buffer.
- The Always-On Buffer: We do not stream traces to the cloud. Instead, we record them in a circular buffer residing within your local process memory.
- Ephemeral Nature: During normal execution, old data is constantly overwritten. Memory usage is fixed and negligible.
- Deep Context Capture: Unlike standard OTel which might strip details, we instrument the runtime to capture Stack Traces (file paths/line numbers), Local Variables (captured at the moment of execution), and Heap Objects (shallow serialized).
- Freeze on Trigger: When an exception is thrown—or you manually trigger it—we "freeze" the buffer. This captures the "history" leading up to the bug without requiring a restart.
- Dev/Test Only: This operates only in development and test environments, ensuring no performance impact on production.
This allows us to capture the "history" leading up to and following a bug without needing to restart the app or add print statements to get context.
Here is simplified pseudo-code for the ring buffer logic:
class TraceRingBuffer {
  constructor(capacity: number) {
    this.buffer = new Array(capacity);
    this.head = 0;
  }

  // Called by OTel hook on every function exit/exception
  push(traceContext: TraceData) {
    this.buffer[this.head] = traceContext;
    // Overwrite old data automatically
    this.head = (this.head + 1) % this.buffer.length;
  }

  getSnapshot() {
    // Return ordered traces starting from the oldest
    return [...this.buffer.slice(this.head), ...this.buffer.slice(0, this.head)];
  }
}
2. Semantic Matching: Finding the Needle
Capturing data is easy; finding the relevant data is hard. A ring buffer might contain thousands of traces. If you ask Cursor, "Why is the shopping cart total wrong?", we cannot simply dump the entire buffer into the LLM's context window—that is both slow and expensive.
Therefore, we designed a Smart Matching layer using embedding search:
- Intent Parsing: We use an LLM to parse your vague query ("shopping cart total") into semantic keywords and code symbols.
- Trace Filtering: We scan the frozen buffer to find traces that touch relevant variables (
cart,price,calculateTotal), threw relevant exceptions, or contain related logs. - Context Injection: We extract only the relevant stack frames and variables, generating a structured JSON format.

3. Privacy First: Local-Only Design
Because we capture runtime data (which may contain API keys, passwords, or PII), security is our primary engineering constraint. Syncause's architecture is designed to be strictly Local-First:
- Local Process: The ring buffer lives inside your application process.
- Local Sanitization: Before data leaves the process, we run a Sanitizer that attempts to redact sensitive information via regex patterns (targeting Keys, Tokens, etc.) and truncates excessively long strings.
- Direct Channel: The sanitized data is sent directly locally to the coding agents you are already using.
Your application's runtime data is never stored on a server; it flows directly from your code to your AI programming assistant.
Conclusion
We believe that "iterative debugging" (Add Logs -> Restart -> Guess) is the bottleneck of the AI programming era. By borrowing concepts from observability and providing "Runtime Context" via memory snapshots to AI Agents, we can move from "guessing" to "fixing."
Syncause currently supports TypeScript/JavaScript, Python, and Java. It is now available for download as a VS Code extension.