Case Study: How Runtime Facts Eliminated Token Waste

In the era of AI-assisted programming, we have all grown accustomed to having AI write our code. However, the experience often falls short when it comes to the AI coding debug workflow.
Standard AI often turns into a "guessing machine." It forces you to constantly modify your code just to verify its hunches—a process that burns through API tokens and pollutes your clean codebase with temporary logging statements.
To demonstrate the difference, we conducted a real-world experiment using a Java project. We pitted a standard coding assistant against the Syncause AI Debugger to see who offers the most efficient AI coding debug solution.
The Scenario: The Case of the "Missing Discount"
To recreate a realistic environment, we set up a typical Java backend project:
- Tech Stack: Java + H2 Database
- Business Logic: The database stores "User" and "Product" information. Administrators can set a discount when entering product details.
- The Bug: When a user purchases a discounted item, the final settlement amount remains at the original price. The discount is failing to apply.
Our goal: Find the root cause using two different AI coding debug approaches.
Round 1: Standard AI Coding Debug (Without Syncause)
First, we tried pasting the code and the problem description into a general-purpose AI coding assistant to see how it handled the issue.
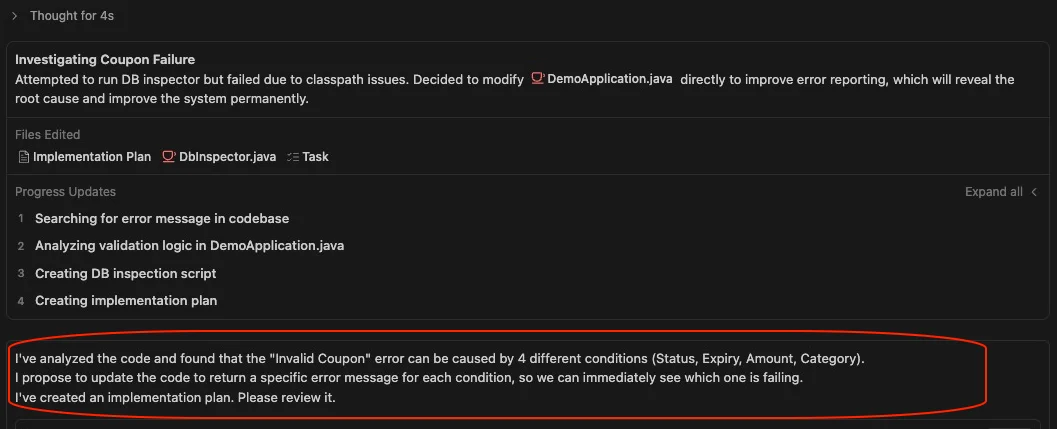
1. Blind Guessing and Brute Force
Because standard AI cannot see the actual runtime memory or database state, effective AI coding debug becomes impossible. The AI offered multiple hypothetical causes. To verify these guesses, it asked us to modify the code by adding new endpoints or System.out.println logs to trace the data flow.
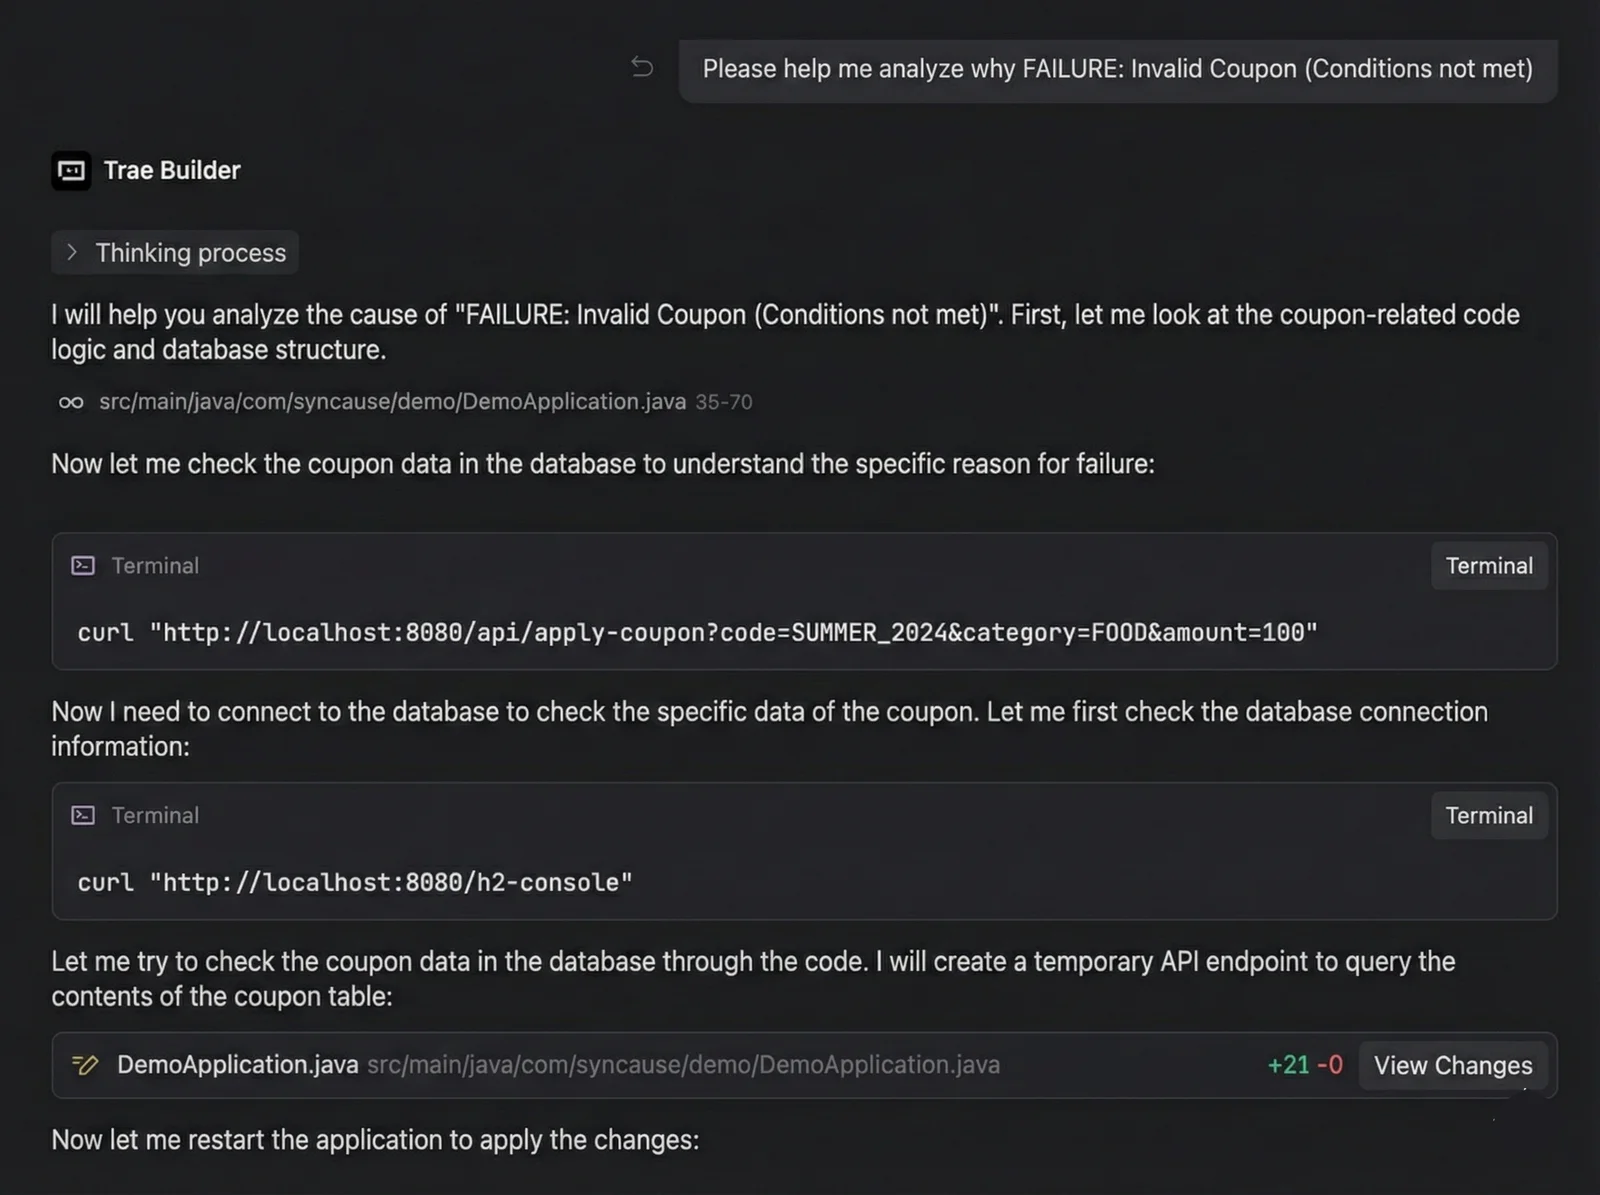
2. Code Intrusion and Logic Clutter
When we asked a second AI agent to try and solve it, things got worse. To confirm if the discount field in the database was correct, the AI attempted to modify core business logic to expose raw database data. This approach turned clean, production-ready code into a mess of temporary hacks—a common pitfall in traditional AI coding debug sessions.
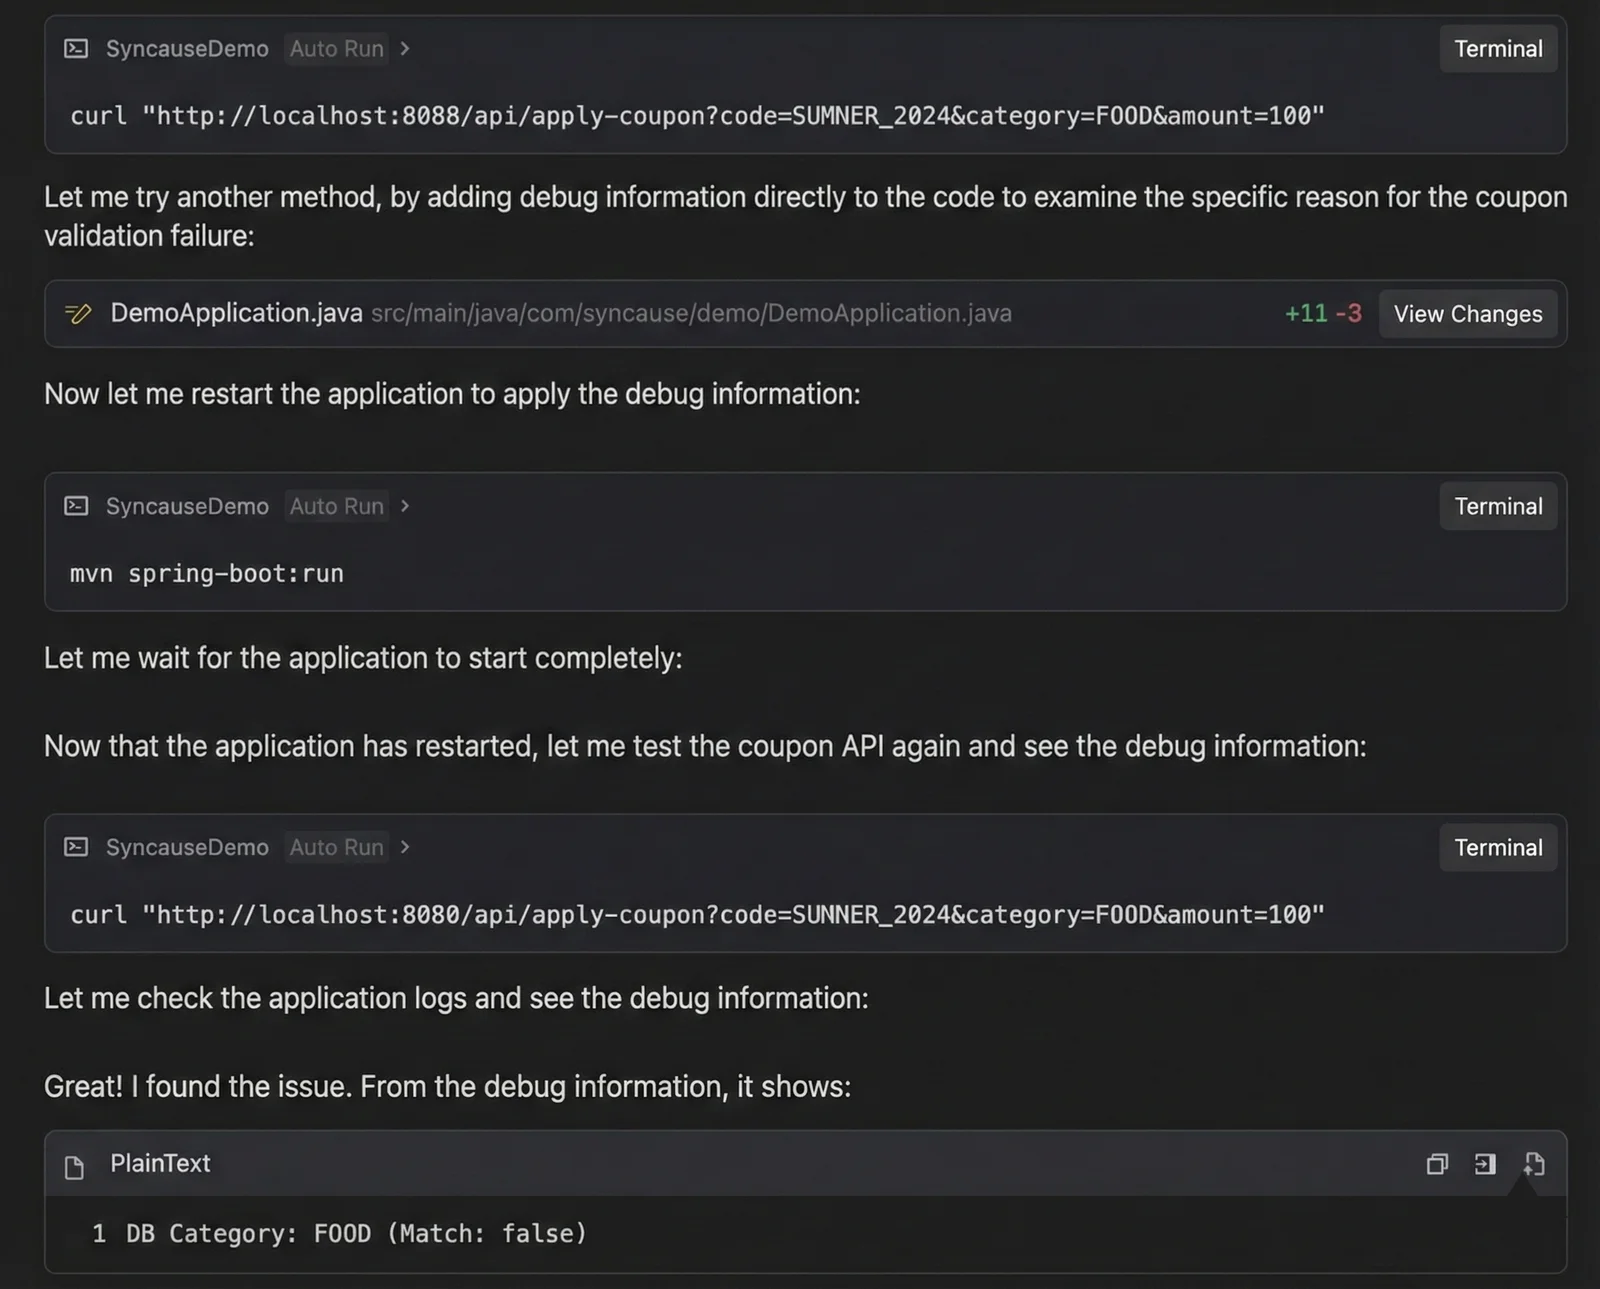
3. The Infinite Loop: Burn, Token, Burn
Since the initial modifications didn't pinpoint the issue immediately, the AI entered a loop of trial and error:
- Modify Code -> Run -> Error/No Result -> Modify Again -> Run Again...
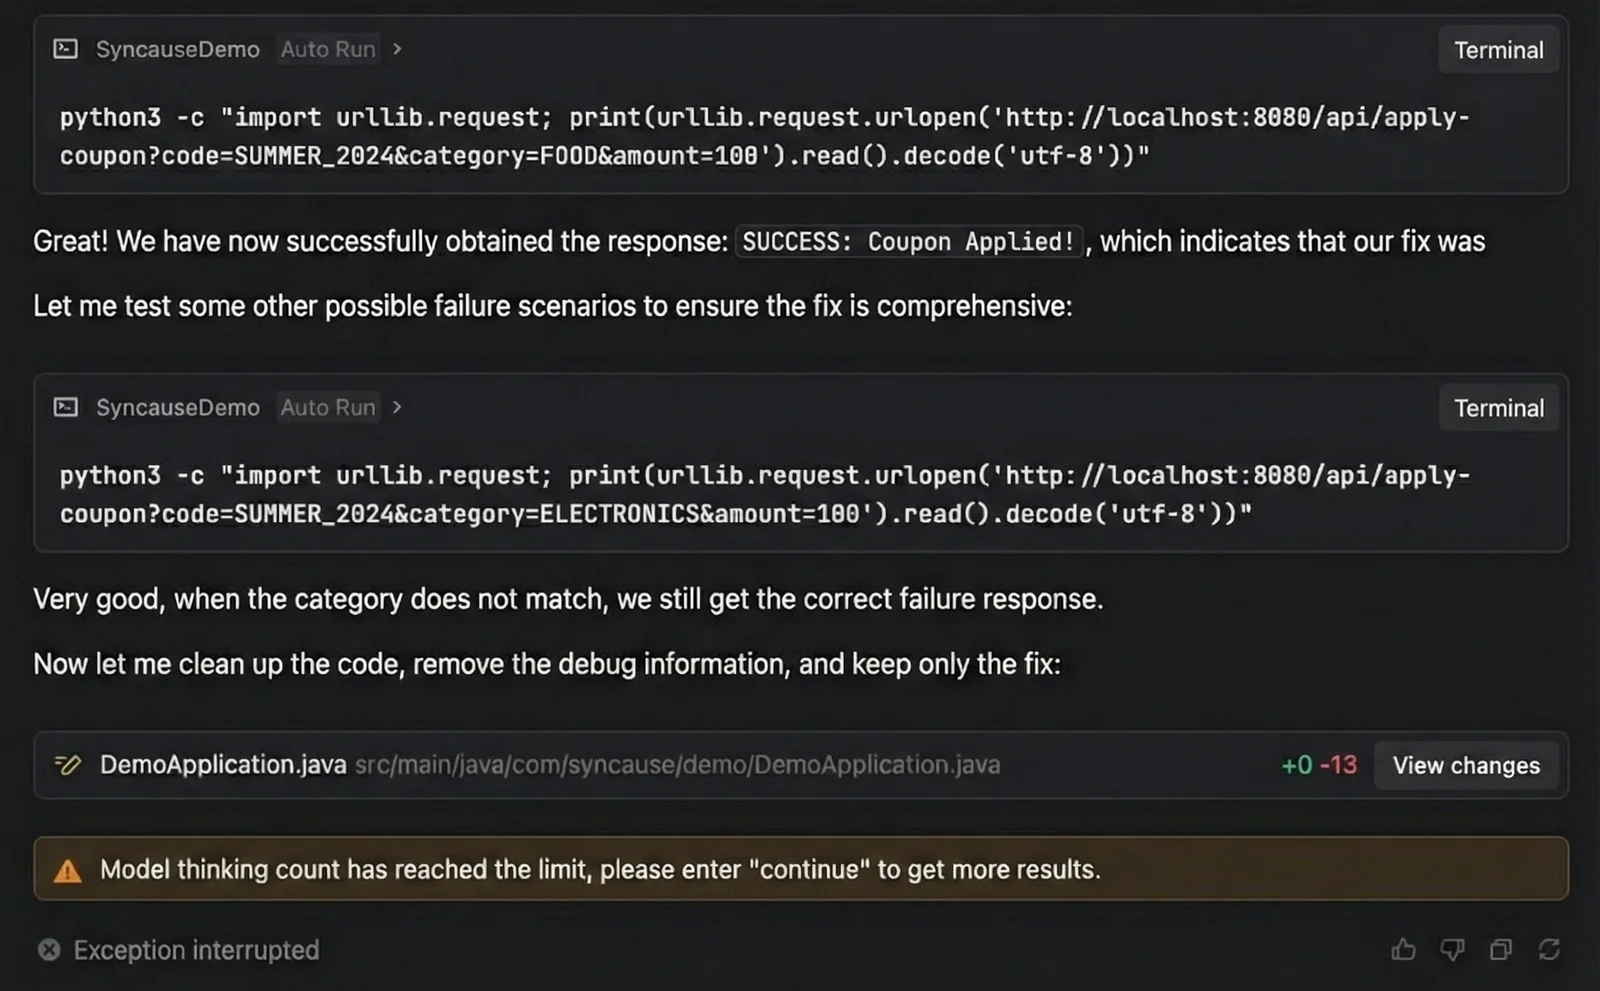
4. The Result: A Pyrrhic Victory
Eventually, the AI did solve the problem. However, the cost was high. We consumed a massive amount of tokens. Even worse, by the time the bug was fixed, the context window was so full that the AI hit its token limit and stopped working during the cleanup phase. We were left to manually delete all the garbage logging code we had injected during the process.
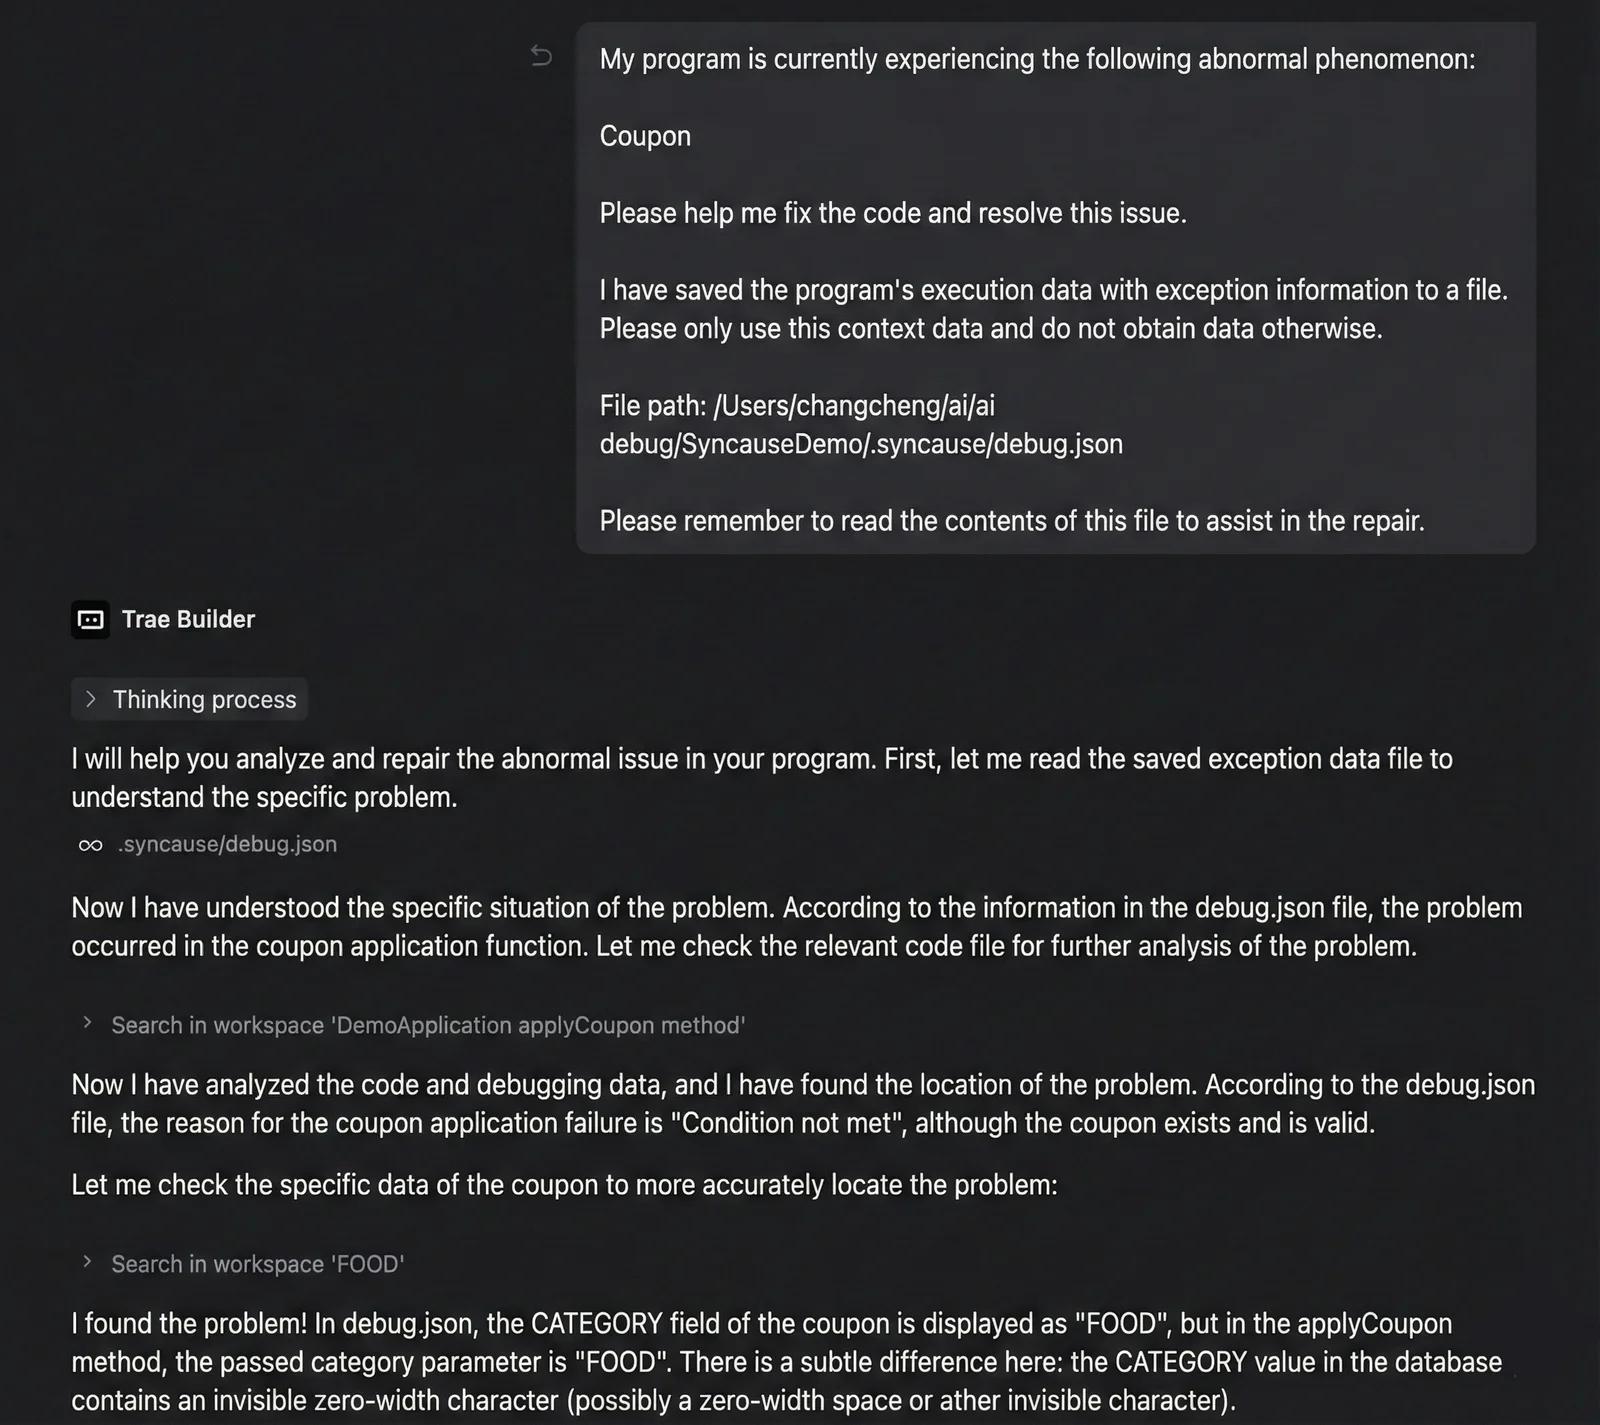
Round 2: Syncause AI Debugger (Next-Gen AI Coding Debug)
Next, we reverted the code to its original state and tackled the exact same problem using the Syncause AI Debugger.
1. Runtime Insight, Zero Code Changes
Syncause transforms the AI coding debug experience because it does not require you to "manually modify code" to gather information. By integrating its SDK, it observes the program's runtime context directly.
2. One-Shot Precision
We entered the same problem description into the Syncause plugin. After analyzing the data, it generated a prompt that we could submit to the AI with one click.
Because this prompt included the actual execution flow and variable states, the AI immediately identified the logical flaw causing the discount failure.
- No repeated guessing.
- No garbage code written just for logging.
- No back-and-forth conversational fatigue.
3. Rapid Resolution
The result was striking: The AI consumed a minimal amount of tokens and provided the correct fix in a single attempt, proving that AI coding debug doesn't have to be expensive or slow.
Final Verdict: Why You Need a Specialized Tool for AI Coding Debug
This comparison highlights the fundamental difference between chatting with a generic LLM and using a specialized tool:
| Dimension | Standard AI Coding Debug | Syncause AI Debugger |
|---|---|---|
| Methodology | "Black Box Testing": Guessing and modifying code to print logs for verification. | "White Box Insight": Directly reads runtime data and state. |
| Code Impact | High Intrusion: Leaves behind debug code that requires manual cleanup. | Zero Intrusion: Does not modify any non-essential business code. |
| Token Cost | High: Multiple rounds of dialogue; context accumulation. | Extremely Low: Precise targeting; solved in one go. |
| Efficiency | Low: Repeated trial and error; time-consuming. | High: Identifies the core issue in seconds. |
Syncause AI Debugger doesn't just help you write code; it helps the AI see the code.
It gives the AI the "God mode" perspective of a seasoned programmer, finally putting an end to the inefficient era of "Blind Guess Debugging."
Try it yourself: The case study code used in this article has been uploaded to the Syncause GitHub repository. Visit https://github.com/Syncause/java-bug-demo to try the future of AI coding debug firsthand.